

Ethereum price fell below the key $2,000 support level as institutional outflows, geopolitical tensions and a bearish technical breakdown weighed on market sentiment.
Summary
Ethereum price fell below the key $2,000 support level as spot ETF outflows, weak US demand and risk-off sentiment weighed on the market. A break below a descending parallel channel exposed downside targets near $1,900 and $1,825, with major support clustered around February lows. CoinGlass data shows major liquidation clusters between $2,100 and $2,150, while analysts warn that a loss of the $1,900-$1,950 zone could trigger a deeper decline.
According to data from crypto.news, Ethereum (ETH) price was trading near $1,990 at press time after slipping below the psychological $2,000 threshold for the first time in months. The move came amid persistent selling pressure across US markets, with traders growing increasingly defensive as risk appetite across both crypto and traditional assets deteriorated.
A sharp decline in US spot demand appears to be one of the immediate drivers behind the collapse. Market participants pointed to a deeply negative Coinbase premium, a measure that compares ETH prices on Coinbase to foreign exchanges.
The premium’s move into negative territory suggests that selling in the US has overtaken global buying interest, removing an important source of support around the $2,000 area.
At the same time, capital continues to flow from Ethereum investment products. SoSoValue data shows spot Ethereum exchange-traded funds recorded $241 million in net outflows over the past week, extending monthly withdrawals to around $540 million.
Outside of crypto markets, rising geopolitical uncertainty added another layer of pressure. Traders focused on developments around the United States and Iran, while increased crude oil prices reignited inflation concerns.
Higher energy costs threaten to complicate the Federal Reserve’s policy outlook and reduce expectations for near-term interest rate cuts, a backdrop that has historically weighed on risk assets.
Digital asset funds have already started to feel the effects. Recent industry data showed around $2.8 billion exiting crypto investment products over the past week, highlighting the cautious stance many investors have taken amid macroeconomic uncertainty.
Ethereum confirms major technical collapse below multi-month support
Ethereum’s latest drop also completed a significant technical breakdown on higher time frames.
The daily chart shows Ethereum breaking below the lower boundary of a descending parallel channel that has contained price action since January. Sellers forced ETH below both the channel support and the 0.786 Fibonacci retracement level near $2,100 before pushing the tick below the psychological $2,000 mark.
The collapse leaves the February low near $1,825 as the next major downside target, while former channel support around $2,100 now serves as immediate resistance.
Several trend indicators continue to favor sellers. Ethereum is trading below its Supertrend resistance near $2,195 and remains below the 20-day, 50-day and 200-day moving averages. Those levels now form successive layers of overhead resistance between around $2,100 and $2,400.
Momentum indicators have yet to show signs of a meaningful reversal. The weekly relative strength index is near 37, keeping ETH in weak territory despite avoiding oversold conditions. Meanwhile, the weekly MACD remains below its signal line after failing to produce a bullish crossover during May’s recovery attempt.
A long-term chart structure also presents a bearish picture. Ethereum continues to trade within a descending channel containing price action since the second half of 2025. The upper boundary of that channel currently sits near $2,300, while the lower boundary crosses near the $1,750-$1,800 region.
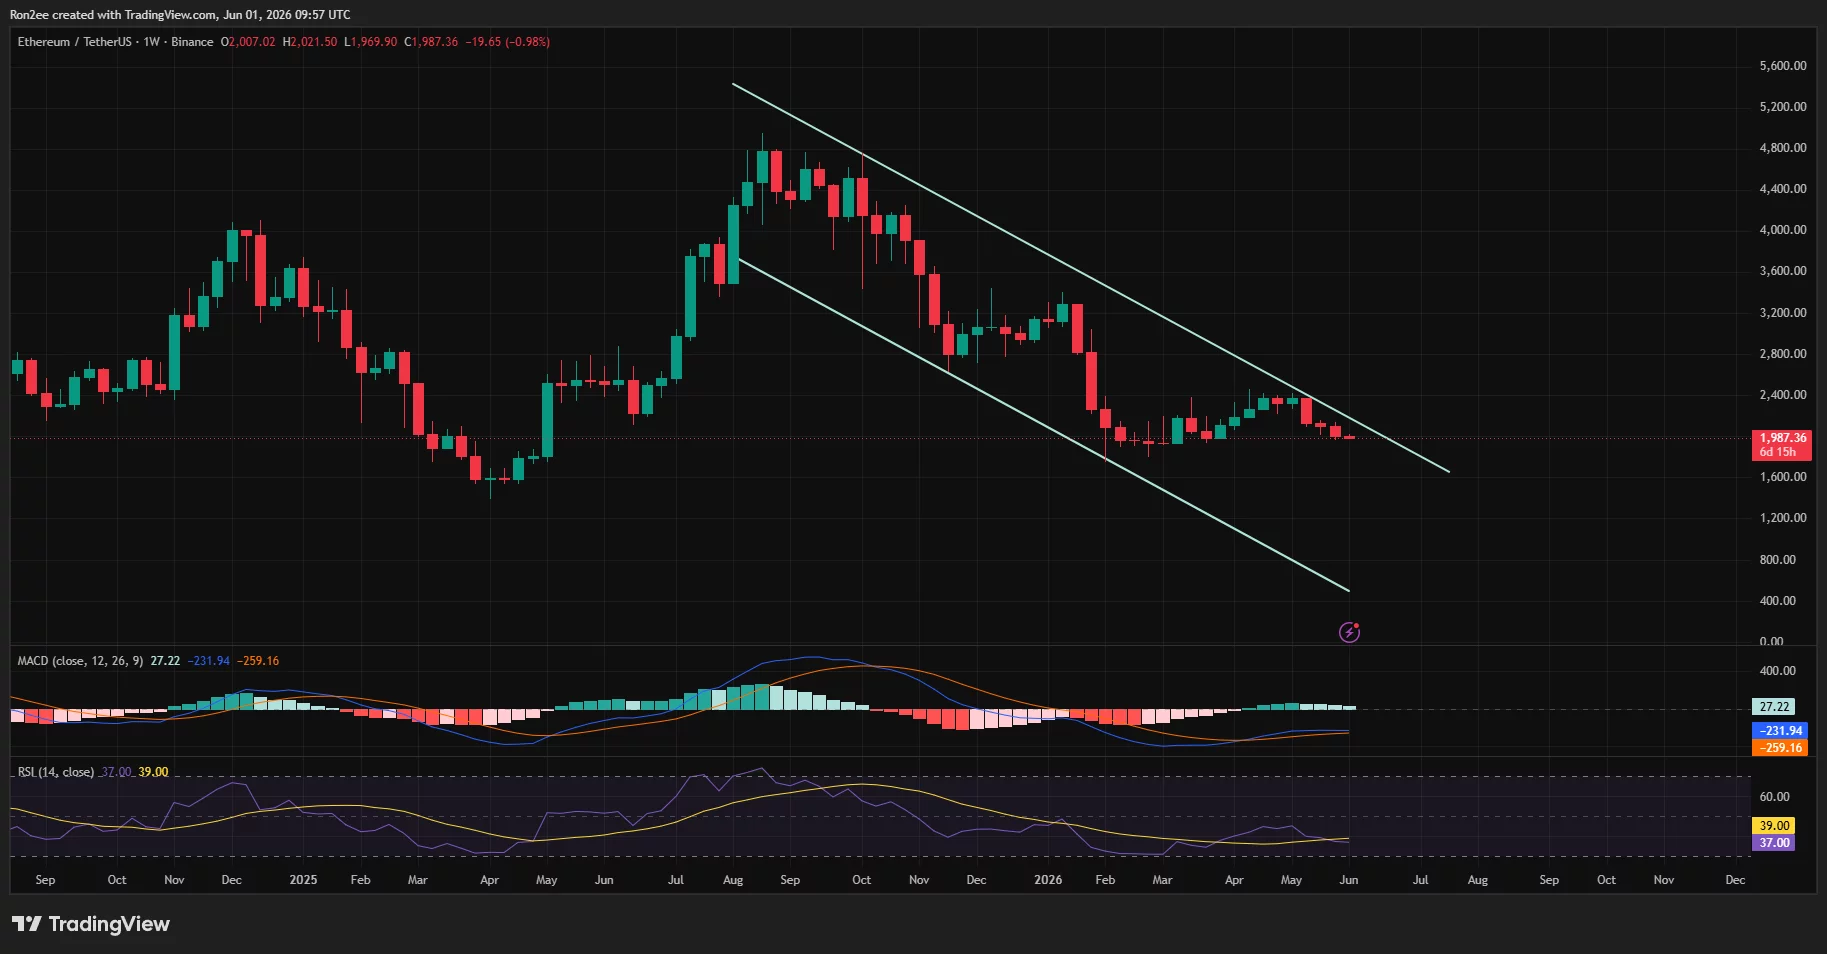
Commenting on the setup, crypto analyst Ali Martinez argued that Ethereum is approaching an important support zone.
“Ethereum is nearing the bottom of its channel near $1,825. That area could provide a favorable risk-reward entry targeting $2,073 and $2,360 as long as the price remains above $1,750 on a daily closing basis.”
Fellow analyst Ted Pillows identified $1,900-$1,950 as the next major support region after the $2,000 loss. According to Pillows, a failure to hold that zone could open the door to fresh cycle lows.
Derivatives positioning suggests that traders are preparing for increased volatility around those levels.
CoinGlass Liquidation Heatmaps show one of the largest nearby liquidity clusters concentrated between $2,100 and $2,150. A large amount of leveraged short positions appear stacked in that range, creating a potential magnet if Ethereum manages to reclaim lost support. Under current prices, notable liquidation bags sit around $1,950 and stretch into the $1,900 area.
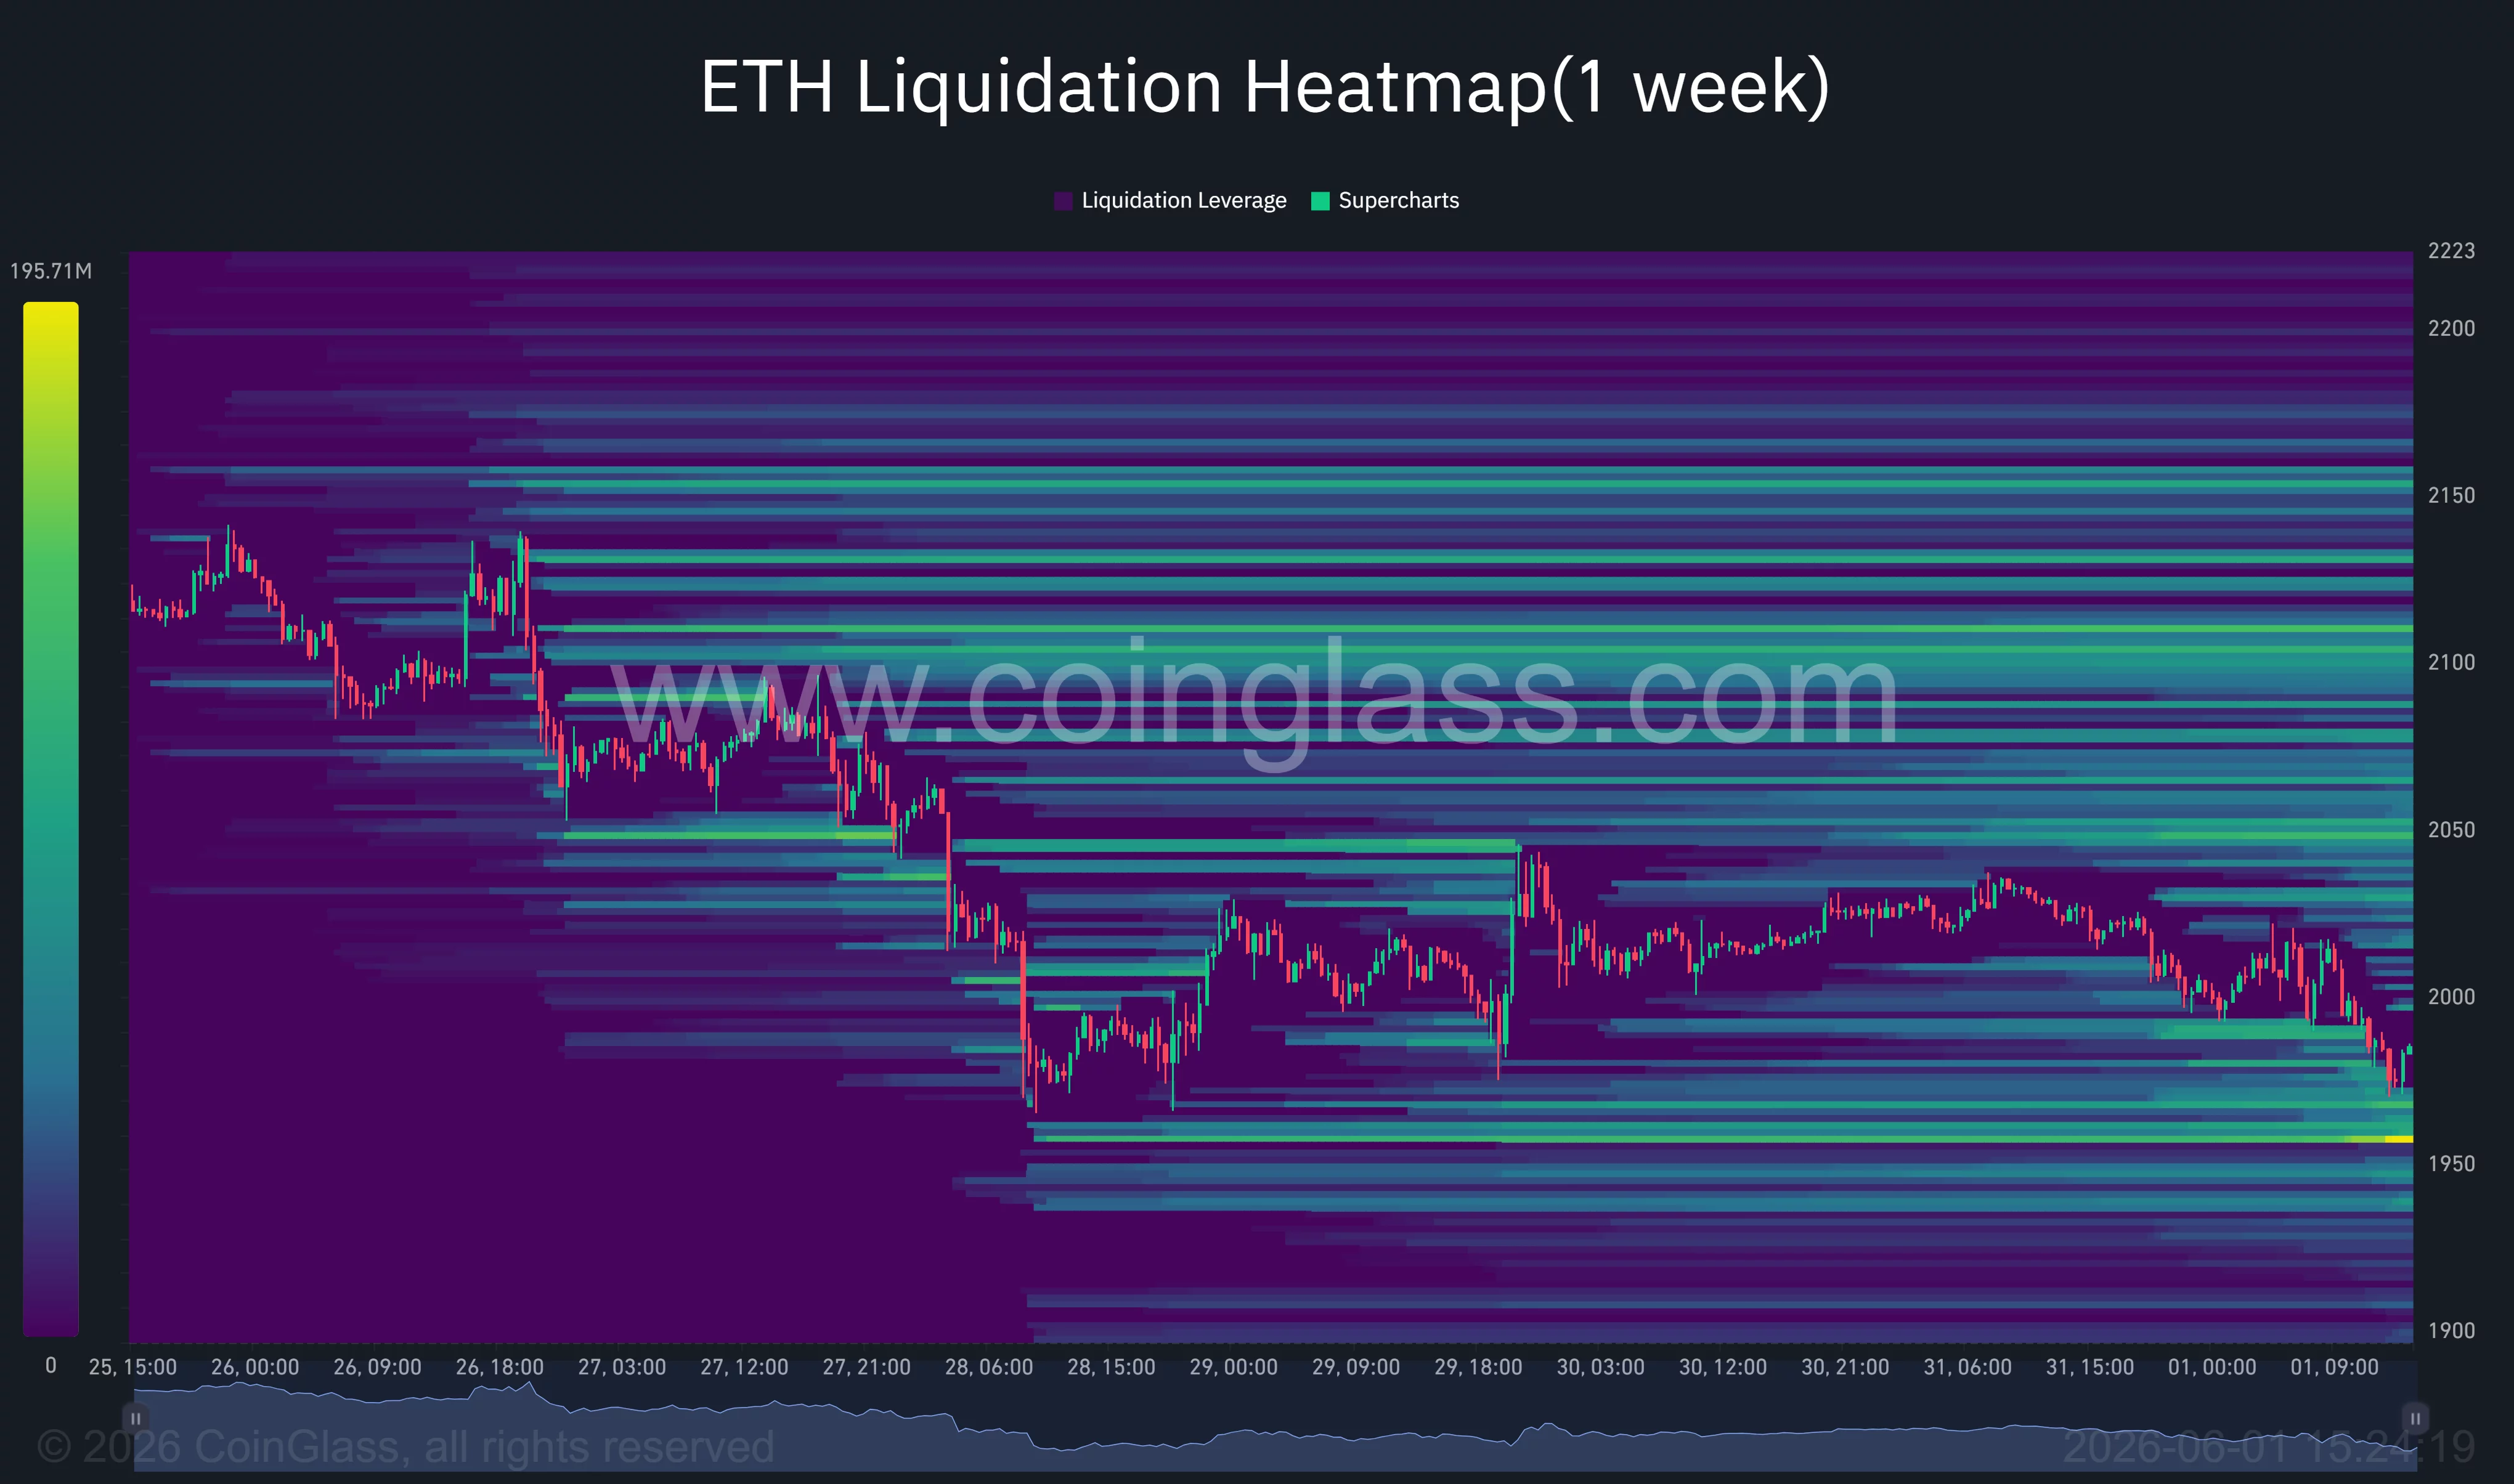
The concentration of leverage below the spot price increases the risk of another liquidation cascade if support levels fail. Such events often accelerate downward moves, as forced long liquidations add additional market sell orders.
ETF outflows and macro risks keep pressure on Ethereum
Institutional participation weakened noticeably during the latest correction.
Spot Ethereum ETFs have now lost more than half a billion dollars over the past month, a stark contrast to the strong inflows seen earlier this year. Continued redemptions have coincided with declining relative performance against Bitcoin, as investors continue to favor the largest cryptocurrency during periods of market uncertainty.
Capital rotation into artificial intelligence-linked technology stocks has also attracted attention among market participants. Several analysts have noted that investors seeking growth exposure have increasingly shifted to mega-cap technology companies rather than digital assets, reducing speculative demand across crypto markets.
Meanwhile, stronger-than-expected inflation readings driven by higher energy costs could force policymakers to maintain restrictive monetary conditions for longer. Such an outcome is likely to keep pressure on liquidity-sensitive assets, including Ethereum.
A sustained recovery above $2,100 will weaken the immediate bearish case and bring the $2,150 liquidation group back into focus. Breaking through that region could trigger short covering and expose resistance levels near $2,360 and $2,400.
For now, however, sellers retain control of the trend. Unless buyers quickly reclaim the $2,000-$2,100 region, technical targets around $1,900, $1,825, and possibly the lower channel boundary near $1,800 are likely to remain in focus.
Disclosure: This article does not represent investment advice. The content and materials on this page are for educational purposes only.
Disclaimer for Uncirculars, with a Touch of Personality:
While we love diving into the exciting world of crypto here at Uncirculars, remember that this post, and all our content, is purely for your information and exploration. Think of it as your crypto compass, pointing you in the right direction to do your own research and make informed decisions.
No legal, tax, investment, or financial advice should be inferred from these pixels. We’re not fortune tellers or stockbrokers, just passionate crypto enthusiasts sharing our knowledge.
And just like that rollercoaster ride in your favorite DeFi protocol, past performance isn’t a guarantee of future thrills. The value of crypto assets can be as unpredictable as a moon landing, so buckle up and do your due diligence before taking the plunge.
Ultimately, any crypto adventure you embark on is yours alone. We’re just happy to be your crypto companion, cheering you on from the sidelines (and maybe sharing some snacks along the way). So research, explore, and remember, with a little knowledge and a lot of curiosity, you can navigate the crypto cosmos like a pro!
UnCirculars – Cutting through the noise, delivering unbiased crypto news


