
 price may peak at this price in August 2025")
This week, Bitcoin touched its November 2021 all-time high (ATH) of $69,000. After 847 days, the largest cryptocurrency has returned to the top of the previous cycle and may soon re-enter price discovery territory.
This historical event is perfect for comparing data from previous Bitcoin cycles. Long-term technical analysis of previous cycles allows us to estimate the peak of the BTC price for the current cycle and when it should be reached.
Perhaps the upcoming halving of Bitcoin is still the basis for determining the 4-year cycles of the cryptocurrency market. If so, a new bull market could take the BTC price to the $155,000 – $175,000 range, which should be reached sometime between April and August 2025.
The Lows and Peaks of Bitcoin Historical Cycles
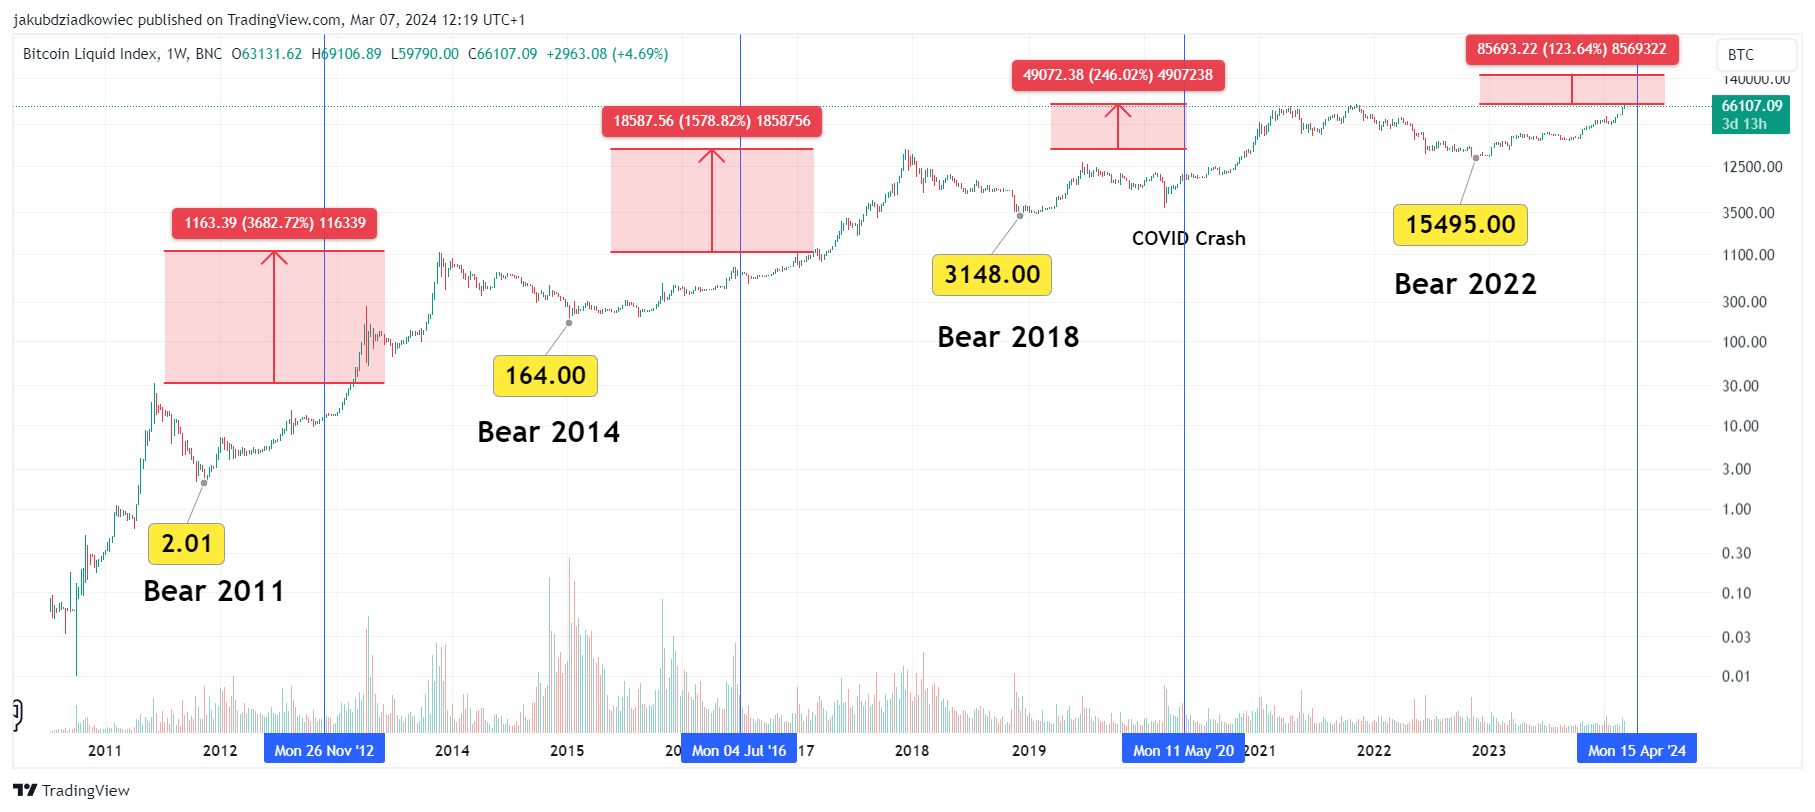
The first and most obvious set of data that can be gleaned from historical cycles is information about the lows and peaks of the BTC price. One can estimate the likely peak of that cycle by measuring the falling ratio between the price range of successive cycles.
The initial uptrend, which began with BTC worth $0.01, ended with a high of $31.90 in June 2011. Bitcoin then fell to a first-cycle low of $2.01 in November 2011.
This event started the bull market after the first halving (November 2012). Bitcoin price rose to the historical ATH at $1,177 in November 2013. The bull market thus resulted in a 586x increase. This was followed by the 2014 bear market, which took the BTC price to a macro bottom at $164 in January 2015. From then until December 2017, Bitcoin again experienced a long-term uptrend.
Meanwhile, there was a second BTC halving, which took place in July 2016. The peak of the BTC price was at $19,764. In the second cycle, the price of BTC increased 121x.
Read more: Where to Trade Bitcoin Futures
Another 2018 bear market led Bitcoin to a low of $3,148 in December 2018. Increases followed this delayed only by the COVID-19 crash of March 2020.
However, after the third halving (May 2020), the BTC price rose parabolically. It ended with a double peak formation and the current ATH at $69,000 in November 2021. During the third cycle, Bitcoin climbed 22x.
BTC price prediction based on cyclic multiplier
The last known and closed macro period of BTC price history is the 2022 bear market. The largest cryptocurrency generated a macro bottom at $15,495 in November 2022. Since then, the price has risen, and this week it again recorded ATH.
How high will Bitcoin grow relative to its macro bottom? According to historical data, we have the following descending order of multipliers of successive cycles:
cycle 1: 586x cycle 2: 121x cycle 3: 22x forecast for the current cycle: 10x
So, if the Bitcoin price were to increase by “only” 10x during this cycle, the peak would occur around $155,000. At the same time, that would be about 2.2x the current high of $69,000.
It seems that if Bitcoin’s new high is reached only 2.2x above the current ATH, it would not be something unexpected. Looking at data from historical cycles, the price of BTC has been rising lower and lower above its previous ATH:
cycle 1: 37x cycle 2: 16x cycle 3: 3.5x forecast for the current cycle: 2.2x
Therefore, the conservative target of $155,000 corresponds to the historical multipliers of the BTC price, counting from macro lows to peaks and the increase above the previous ATH.
BTC price peak between April and August 2025
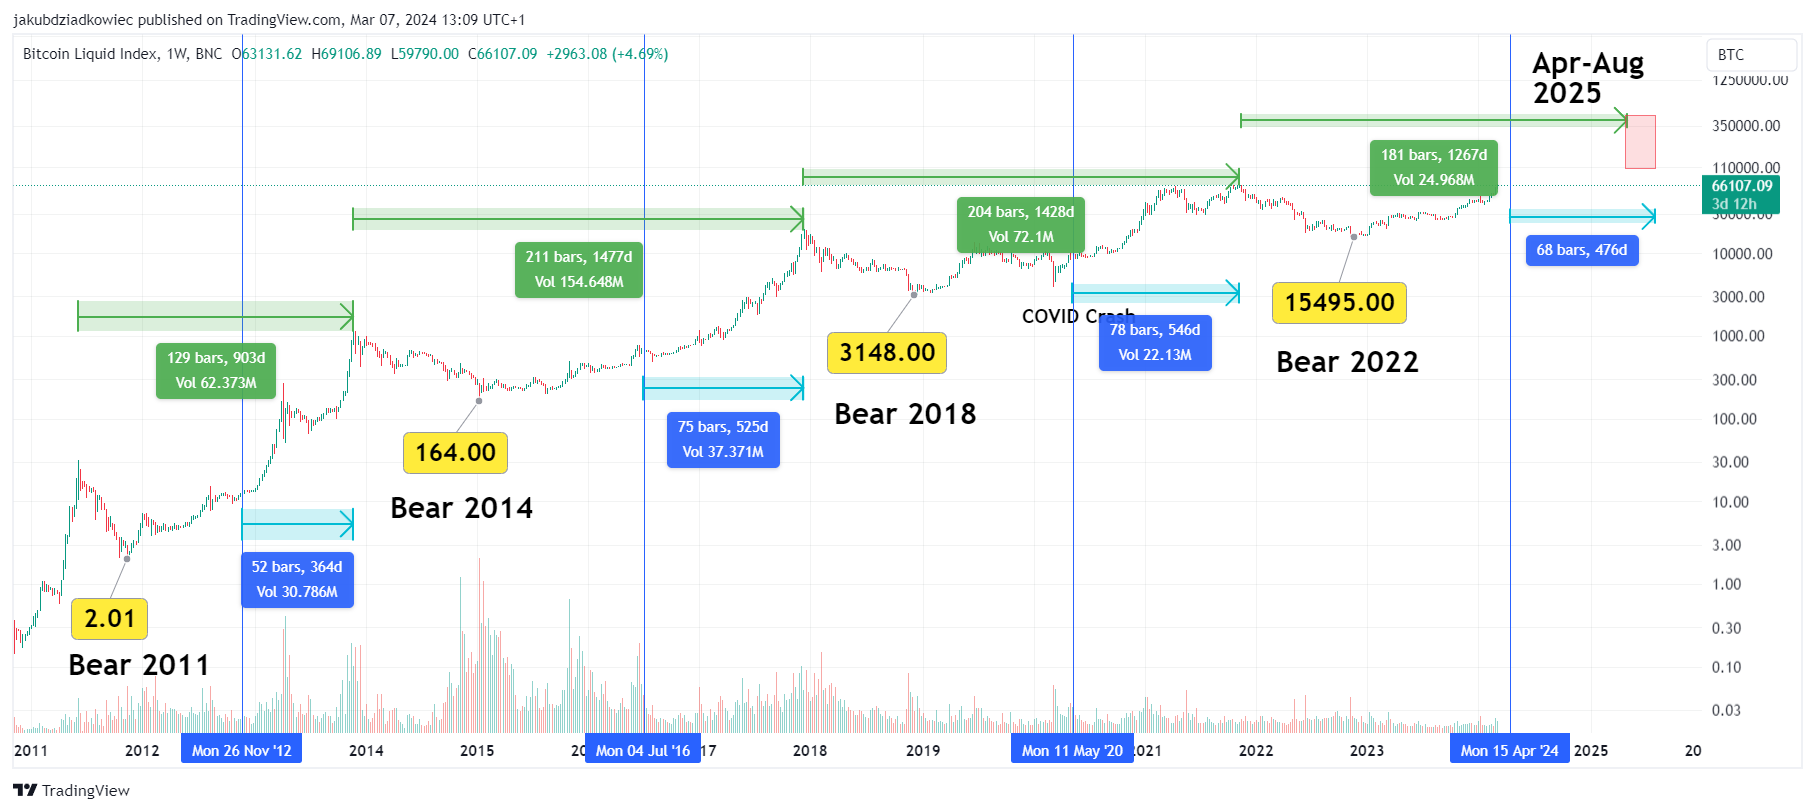
Another way to estimate the details of Bitcoin’s ongoing cycle is to measure the time after successive all-time highs have been reached. This will make it possible to determine the approximate time when the cryptocurrency market will reach extreme euphoria. Such conditions are the last moment to close your positions, as the specter of a bear market is already looming on the horizon.
Here too, measurement can be done in at least two ways. The first – is by measuring from the previous all-time high to the next peak (green). The second measures from the halving to the all-time high (blue). By analyzing previous cycles, we get the following data:
cycle 1: 129 weeks and 52 weeks cycle 2: 211 weeks and 75 weeks cycle 3: 204 weeks and 78 weeks forecast for the current cycle: 181 weeks and 68 weeks
To get the forecast for the current cycle, we extract the arithmetic mean from the historical data. Hence, the date range for a potential BTC price cycle peak is from the end of April to the beginning of August 2025 (red area).
Fib levels suggest a high at $175,000
Another way to estimate the price of BTC at the end of the current cycle is to measure it based on Fibonacci (Fib) retracement levels. To do this, one measures the Fib retracement from the cycle peak to the macro bottom. The external Fib retracement above the previous all-time high is then used to determine where the BTC price has reached in the next cycle.
Again, here we find the BTC price reaching lower and lower Fib levels on the logarithmic scale in successive cycles. However, the exception is the second cycle, in which the high at $19,764 reached the 2,414 Fib level. In contrast, in the first cycle it was slightly lower at 2,272 Fib.
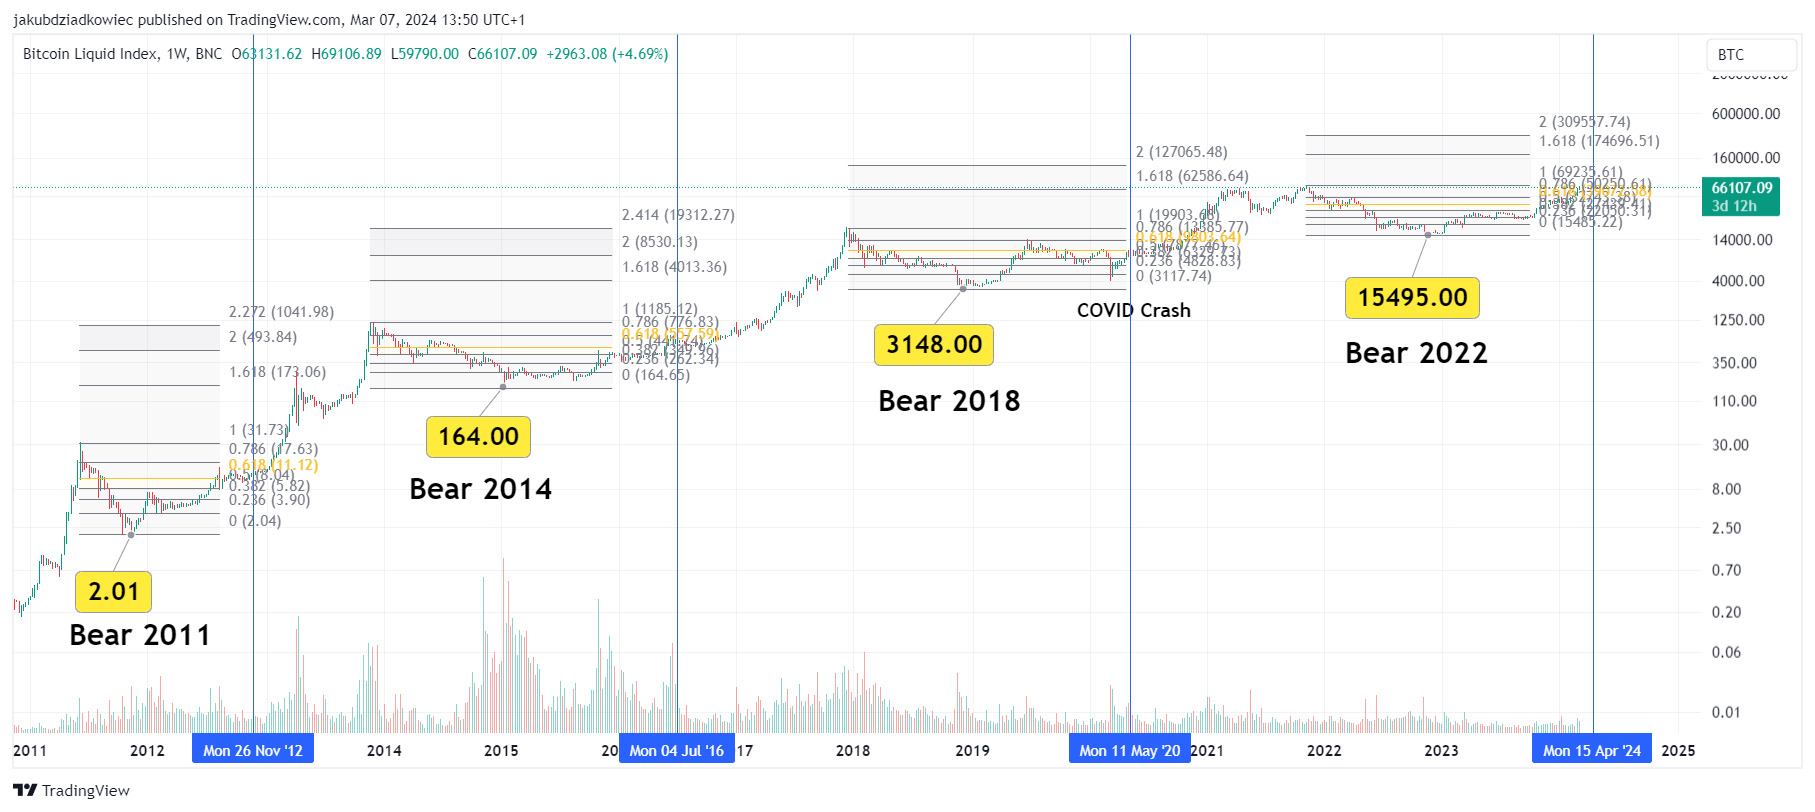
However, in the previous third cycle, the Bitcoin price only managed to reach the 1.628 Fib external retracement of the previous cycle. This is the first and most common target for price discovery phases above the historical ATH.
If this scenario were to repeat itself in this cycle, Bitcoin would have peaked at $175,000. However, data derived from the price multiplier of previous cycles and the increase above the previous ATH point to a peak of $155,000.
Read more: Who owns the most Bitcoin in 2024?
Therefore, we conclude that the range of $155,000 – $175,000 is the most likely target for a new all-time high for this cycle of the Bitcoin market. At the same time, if the temporal agreements with previous cycles are maintained, this will happen sometime between April and August 2025.
Click here for BeInCrypto’s latest crypto market analysis.
Disclaimer
All the information on our website is published in good faith and for general information purposes only. Any action the reader takes on the information found on our website is strictly at their own risk.
Disclaimer for Uncirculars, with a Touch of Personality:
While we love diving into the exciting world of crypto here at Uncirculars, remember that this post, and all our content, is purely for your information and exploration. Think of it as your crypto compass, pointing you in the right direction to do your own research and make informed decisions.
No legal, tax, investment, or financial advice should be inferred from these pixels. We’re not fortune tellers or stockbrokers, just passionate crypto enthusiasts sharing our knowledge.
And just like that rollercoaster ride in your favorite DeFi protocol, past performance isn’t a guarantee of future thrills. The value of crypto assets can be as unpredictable as a moon landing, so buckle up and do your due diligence before taking the plunge.
Ultimately, any crypto adventure you embark on is yours alone. We’re just happy to be your crypto companion, cheering you on from the sidelines (and maybe sharing some snacks along the way). So research, explore, and remember, with a little knowledge and a lot of curiosity, you can navigate the crypto cosmos like a pro!
UnCirculars – Cutting through the noise, delivering unbiased crypto news


.")


