

Over the past three weeks, Bitcoin has disconnected from the overall crypto market, with the coin’s market capitalization of more than 60 percent. In fact, at press time, Bitcoin’s dominance is 60.15 percent. Still, some traders expect major altcoins to start breaking out to counter the rise in BTC’s dominance. Technical analysis of the top five altcoins can give a glimpse of when the trend will change.
Ethereum
Until now, ethereum has appreciated more than 150 percent since its low on December 14, 2018, when it reached $80 after a sharp decline from an all-time high of $1,400 on January 13 of the same year.
Now there are two different patterns with contrasting outcomes forming on ethereum’s weekly chart. One outcome may indicate a continuation of the recent bullish trend, while the other suggests a further decline in market valuation:
An ascending triangle appears to be developing, which may be in its breakout stage. Previously, ETH went through a false break and then pulled back into the triangle and now it looks like it is breaking above it again. The horizontal line at the top of the triangle is drawn along the swing highs, while the rising trend line is drawn along the swing lows. The target of this pattern can be calculated by taking the height of the triangle and adding it to the breakout point. Conversely, a rising wedge appears to be forming on the same chart. It is a bearish pattern that starts with a wide bottom and as prices increase, it contracts and the trading range narrows. Once the support trendline breaks, a target can be measured by subtracting the height of the triangle from the breakout point.
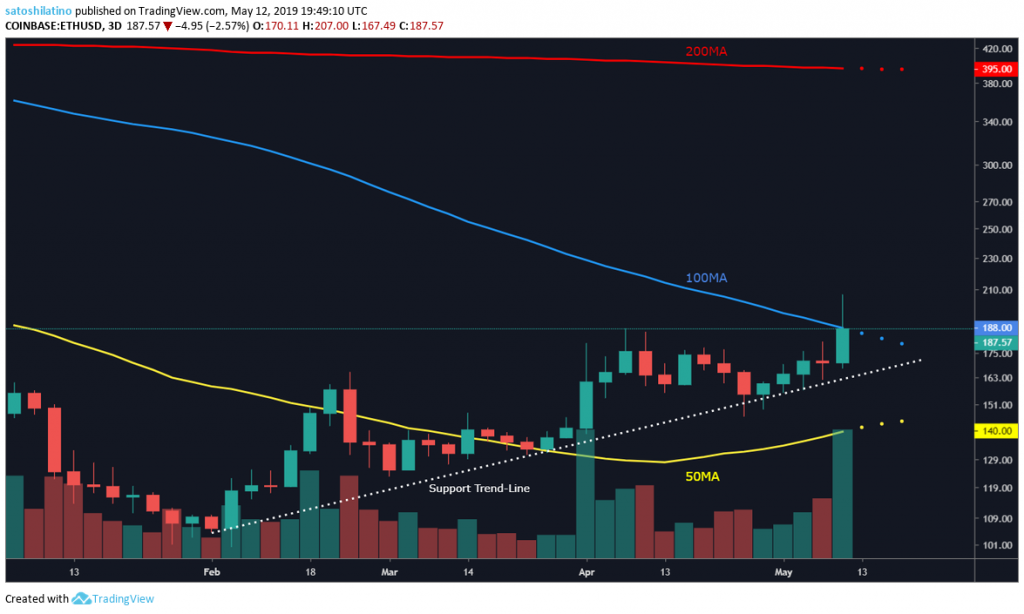
On the three-day chart, ether may be about to break the major resistance it encountered with the 100 three-day moving average, indicating higher prices. If it can break above that, the next resistance level will be determined by the 200 three-day MA, which is currently around $395, and the 100 three-day MA will become a support level. However, if ethereum fails to break out and instead falls in price, it can be held by the support trendline or by the 50-three-day MA which is around $140.
XRP
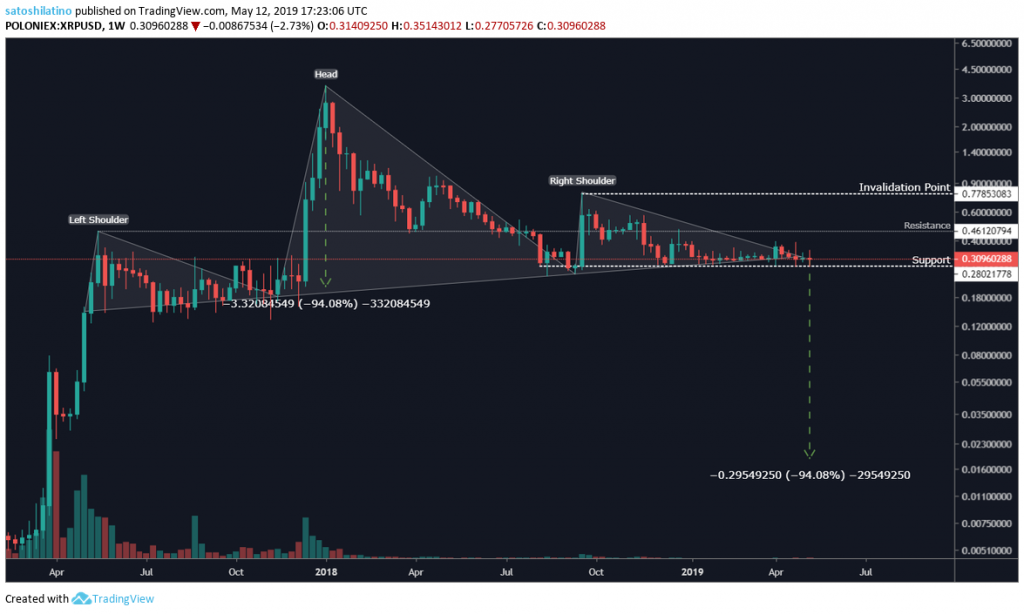
Since the beginning of the year, XRP has shuffled within a trading range without any major price movement. Investors seem to have lost interest in this cryptocurrency, even though it rose more than 64,000 percent in the bull market of 2017, from around $0.005 to $3.45.
A massive Head and Shoulders (H&S) pattern has formed on XRP’s weekly chart, predicting a bullish-to-bearish trend reversal. According to Investopedia, this pattern is considered one of the most reliable trend reversal patterns.
The H&S will be validated if XRP breaks below the “neckline” or support line at $0.28 with significant volume, but it will be invalidated if the price moves above the height of the right shoulder at around $0.78. The target can be calculated by measuring the height between the “head” and the “neckline” and subtracting it from the “neckline”.
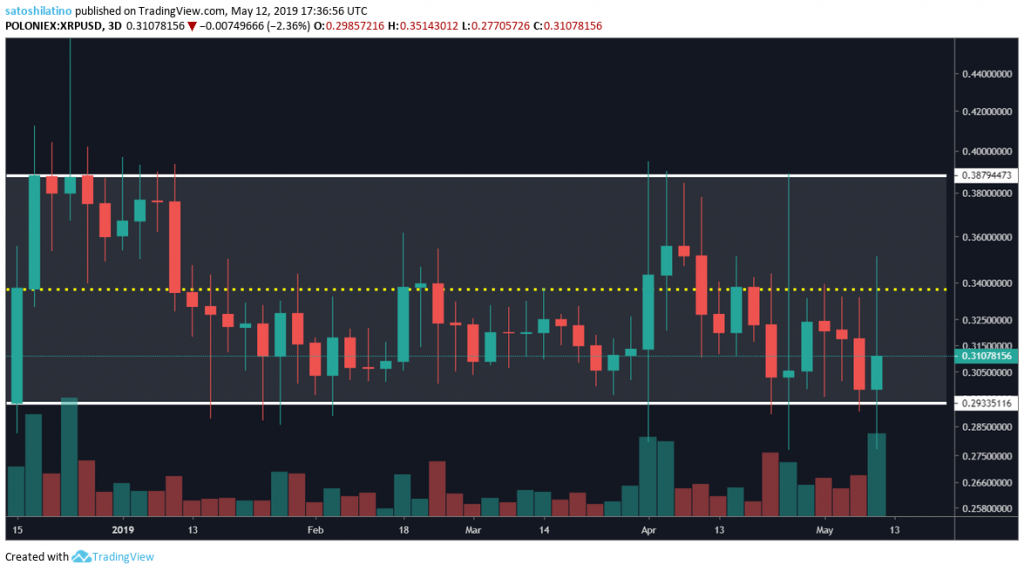
On the three-day chart, XRP can be seen trading within a parallel channel since December 15, 2018. Every time it reaches the top of the channel, it turns around to test the bottom of the channel and vice versa.
Now that XRP is trading at the bottom of the parallel channel, it can be expected to move towards the middle or upper side of the channel based on its recent price action. A break above the top of the resistance line could take XRP to new yearly highs, while a break below the support line could take it to lower lows.
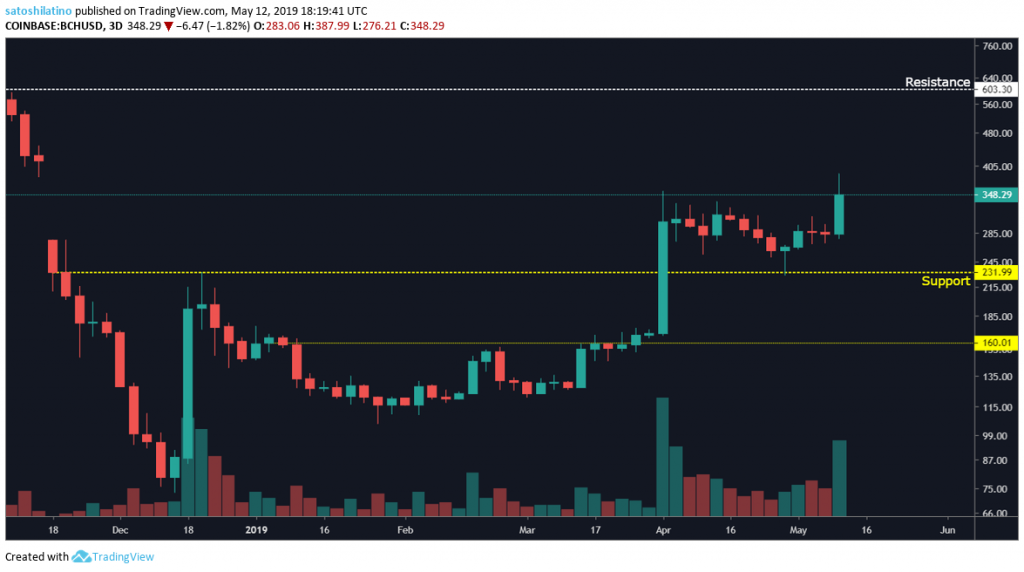
Bitcoin cash
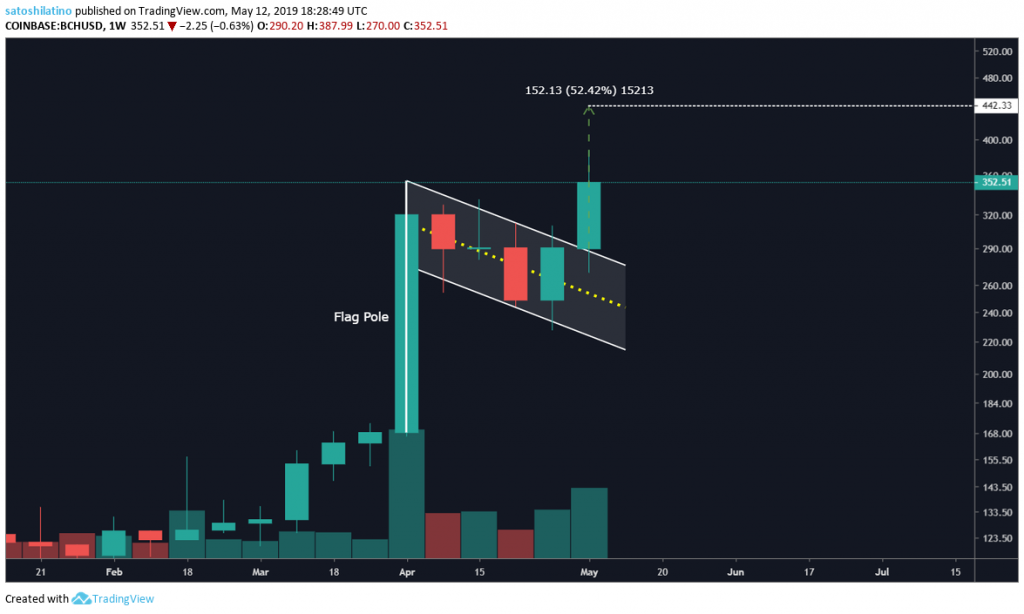
Since the first week of April, bitcoin cash has risen about 130 percent. Even after seeing an exponential increase in its market valuation, it looks like there is more room for BCH to rise.
On the weekly chart, a bull flag has formed and it now appears to be in its breakout stage. A target is given by adding the height of the flagpole, which is about 52 percent, to the top of the flag, which sits at about $290. At the time of writing, bitcoin cash is trading at $352, which is very close to the ultimate target given by this pattern.
The resistance and support levels on the three-day chart indicate that BCH has already broken a major resistance point that has now turned into support, which was the $232 level. The next major resistance point is around $600. BCH will need to trade above $400 first to advance to the next resistance point.
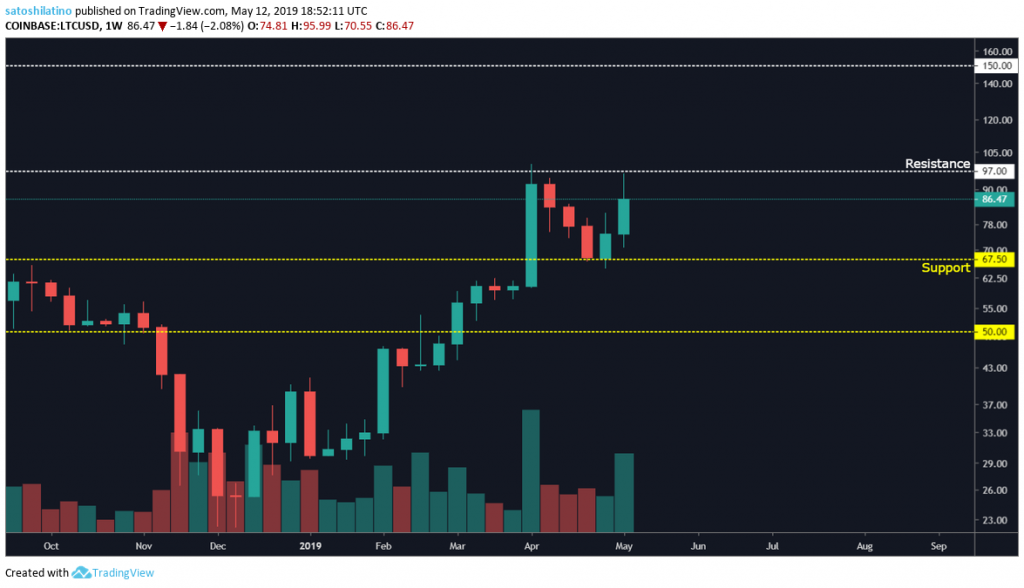
Litecoin
Litecoin has experienced a steady increase in its market valuation since reaching a low of $22 on December 14, 2018. Since then, it has appreciated more than 350 percent. After reaching a high of $100, it failed to break major resistance at $97, after which it retreated to support at $67.5. LTC has now started to rise again along with BTC.
If LTC can break above the $97 resistance level, the next resistance level is around $150. Failure to break above the current level could take it back to the $67.5 support level or even the $50 support level.
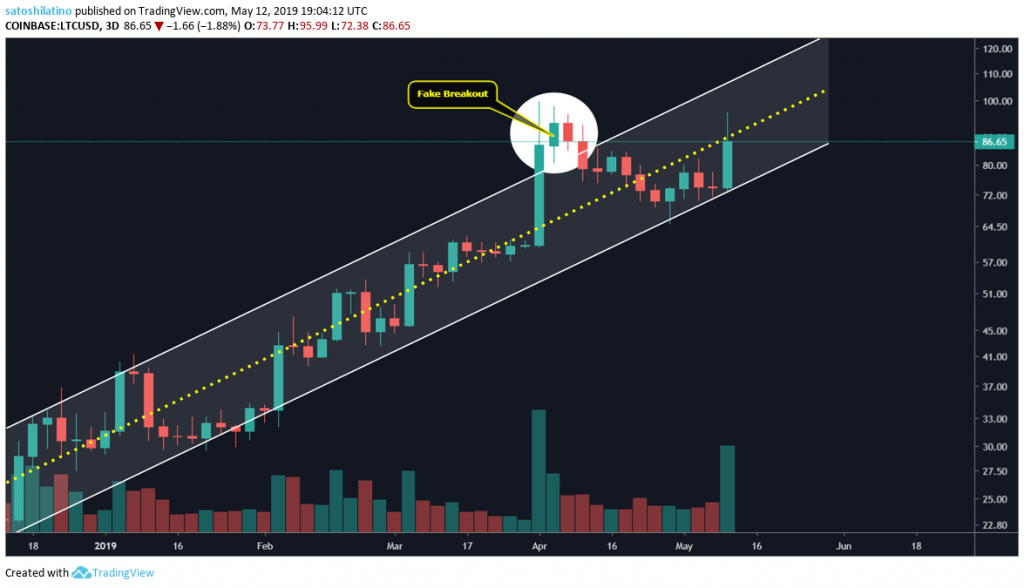
On the three-day chart, litecoin can be seen trading within a rising parallel channel since December 14, 2018. A false breakout of the channel was triggered on April 3, 2019, but it quickly returned to a trading range within the bottom of the parallel channel.
After bouncing back from the bottom line of the channel, LTC seems to be fighting the resistance given by the center line. If it can break above the line, it can go as high as the top line of the parallel channel. A breakout of this pattern could trigger higher highs, while a break below the channel could take it back to the support levels described previously.
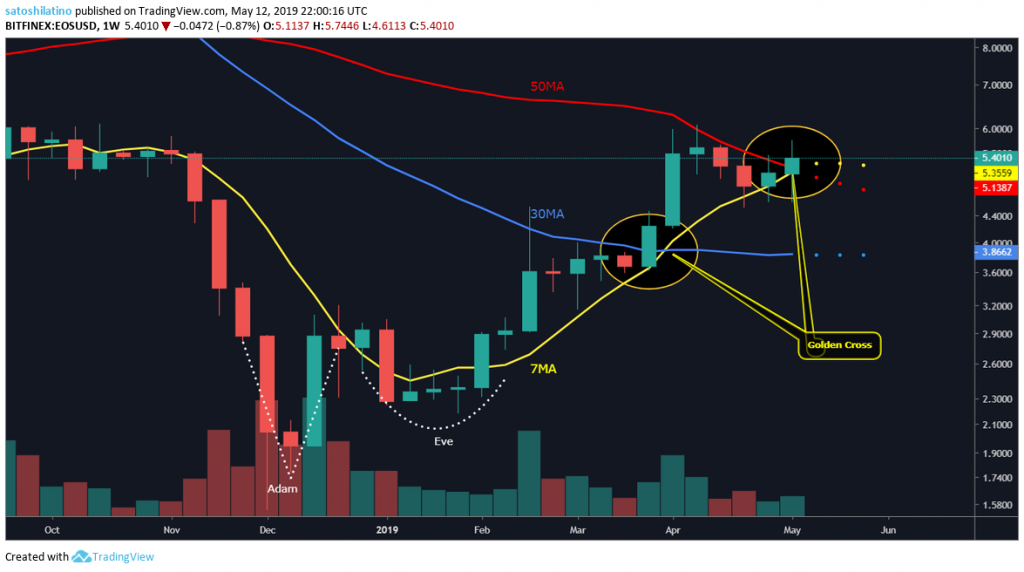
EOS
EOS seems to have formed an Adam and Eve bottom from Dec 2018 to Feb 2019. After breaking the $2.90 resistance level, EOS reached the $6 target given by the pattern.
Based on the weekly chart, EOS formed two consecutive golden crosses between the 7-week MA and the 30-week MA, and the other one between the 7-week MA and the 50-week MA. Investopedia describes a golden cross as one of the most effective patterns for predicting an upcoming bull run.
Ideally, the 30-week moving average should also cross above the 50-week moving average as a final confirmation that the pattern has been validated.
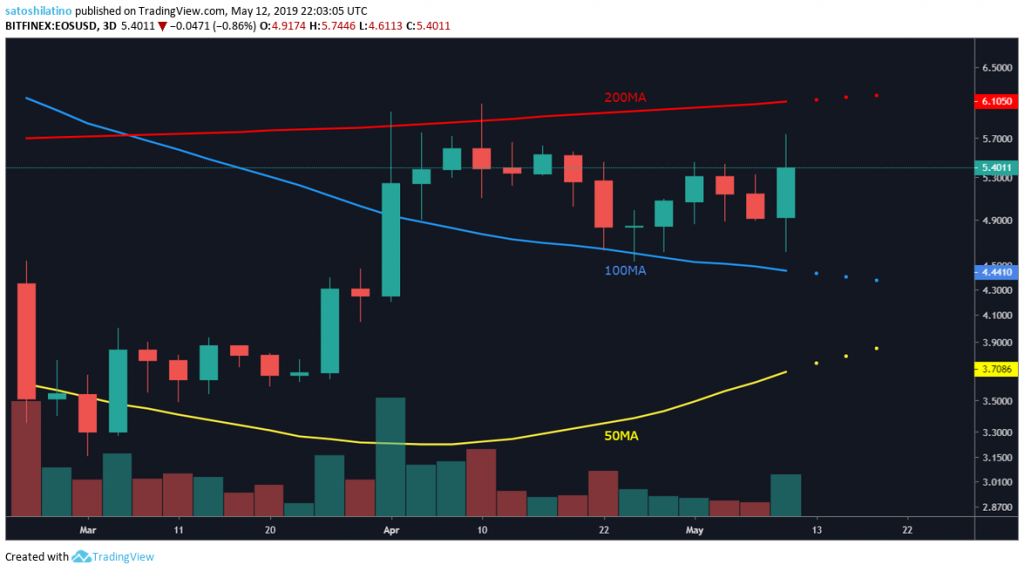
On the three-day chart, EOS trades between the 100 three-day MA – which acts as support – and the 200 three-day MA, which acts as resistance. A break above resistance could take EOS to higher highs, while a break below support could take it down to test the 50-three-day MA.
Overall sentiment
While bitcoin is up more than 130 percent since its low in December, most altcoins have risen the same amount or higher during the same period. Another number of indicators predict that the top altcoins may soon experience bullish momentum. However, XRP may have a bearish future based on this technical analysis.
So far, almost all altcoins have lost value relative to bitcoin over the past month. If these cryptocurrencies can break the various resistance levels described above, this could trigger a rally that allows them to trade at more favorable rates against BTC.
The overall sentiment of the market, as the charts indicate, is bullish. That said, given the rapid rise in prices, a correction in BTC prices could cause panic and wipe out newfound gains for the entire market in the short term.
Disclaimer: None of the information above should be considered investment advice. Trading cryptocurrencies is extremely risky and we advise our readers to only trade what they can afford to lose.
Mentioned in this article
Disclaimer for Uncirculars, with a Touch of Personality:
While we love diving into the exciting world of crypto here at Uncirculars, remember that this post, and all our content, is purely for your information and exploration. Think of it as your crypto compass, pointing you in the right direction to do your own research and make informed decisions.
No legal, tax, investment, or financial advice should be inferred from these pixels. We’re not fortune tellers or stockbrokers, just passionate crypto enthusiasts sharing our knowledge.
And just like that rollercoaster ride in your favorite DeFi protocol, past performance isn’t a guarantee of future thrills. The value of crypto assets can be as unpredictable as a moon landing, so buckle up and do your due diligence before taking the plunge.
Ultimately, any crypto adventure you embark on is yours alone. We’re just happy to be your crypto companion, cheering you on from the sidelines (and maybe sharing some snacks along the way). So research, explore, and remember, with a little knowledge and a lot of curiosity, you can navigate the crypto cosmos like a pro!
UnCirculars – Cutting through the noise, delivering unbiased crypto news


.")


