The Bitcoin price has almost reached the correction target of $60,000, as previously predicted when it was around $71,700.
The question now is whether it will stay at $60,000 or drop further.
Bitcoin Doomsday: Has BTC Already Peaked?
Before delving into the BTC price analysis, it is wise to consider the worst case scenario where Bitcoin could return to its previous low of around $15,500.
However, this outcome seems less likely given the current circumstances. Let’s examine a more realistic scenario.
Bitcoin’s 17% Drop: Ready for More Downside?
The Bitcoin price currently sits 17% below its all-time high (ATH) of around $73,800, near the expected correction target of around $60,000. This aligns with the next significant Fibonacci support at around $60,270, where a bullish bounce could potentially resume the upward trajectory.
However, in a more severe correction scenario, Bitcoin could target the next significant Fib support levels at around $51,500 and $36,000. As long as Bitcoin remains above $36,000, the bullish trend remains intact.
Read more: How to get paid in Bitcoin (BTC): Everything you need to know
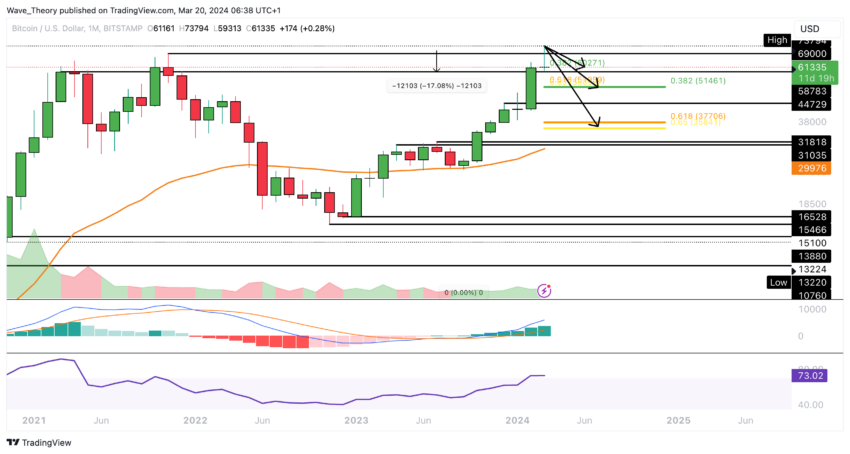
These levels offer opportunities for bullish rebounds, although the extent of the correction’s final destination remains uncertain. Nevertheless, monthly chart indicators, such as the moving average convergence deviation (MACD) histogram showing an upward trend and the MACD lines remaining bullish crossed next to a neutral relative strength index (RSI), do not yet indicate bearish sentiment to.
Is Bitcoin Heading For Another 15% Drop?
If Bitcoin recovers from the 0.382 Fib support around $60,270, it may face resistance around $65,500 and $69,000. Breaking the golden ratio at $69,000 could signal the end of the correction phase and pave the way for a new all-time high (ATH).
Conversely, if Bitcoin breaks below the 0.382 Fib support, it could face further downside potential, targeting support at around $51,500.
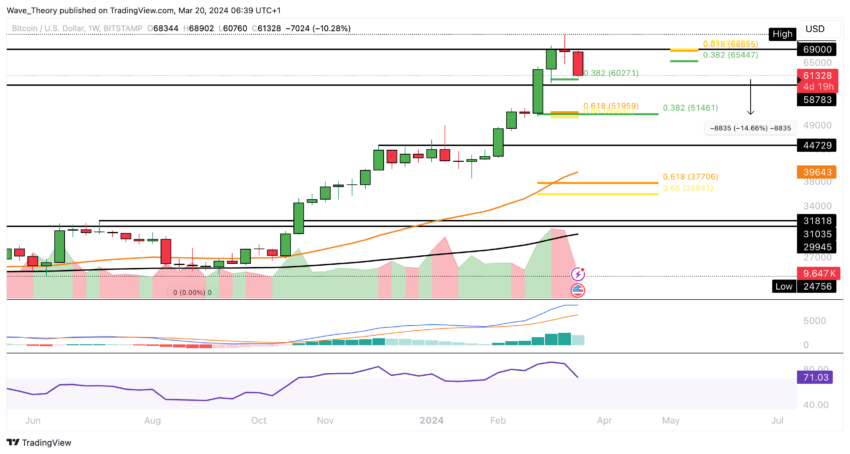
Despite the MACD histogram showing a bearish trend and the RSI being in overbought regions, the MACD lines remain bullish crossed, and the golden cross in the weekly chart indicates that the medium-term trend remains bullish.
What if Bitcoin breaks through Fib supports?
On the daily chart, Bitcoin’s trend remains bullish in the short to medium term, supported by a golden crossing of the EMAs. However, bearish signals are observed with the MACD lines crossing downwards and the MACD histogram showing a bearish trend despite the RSI being in neutral territory.
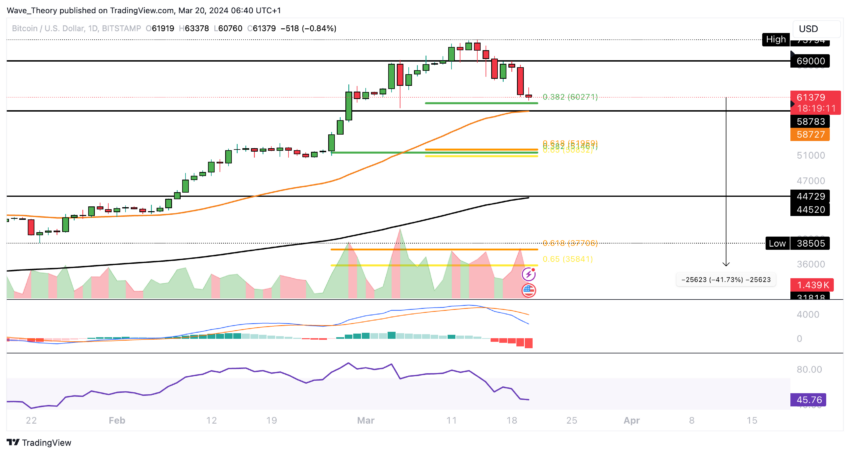
Bitcoin’s price is currently supported by the 50-day EMA around $58,783, with a potential bounce zone between $58,783 and $62,270. Failure to hold these levels could lead to a significant correction, with potential downside targets at around $36,000, supported by the 200-day EMA at around $44,500.
Bitcoin 4H RSI: Anticipating Bullish Divergence
In the 4-hour chart, bearish signals for Bitcoin continue as the MACD lines are crossed downwards and the MACD histogram trends lower. The RSI is approaching oversold territory, but does not indicate a bullish divergence.
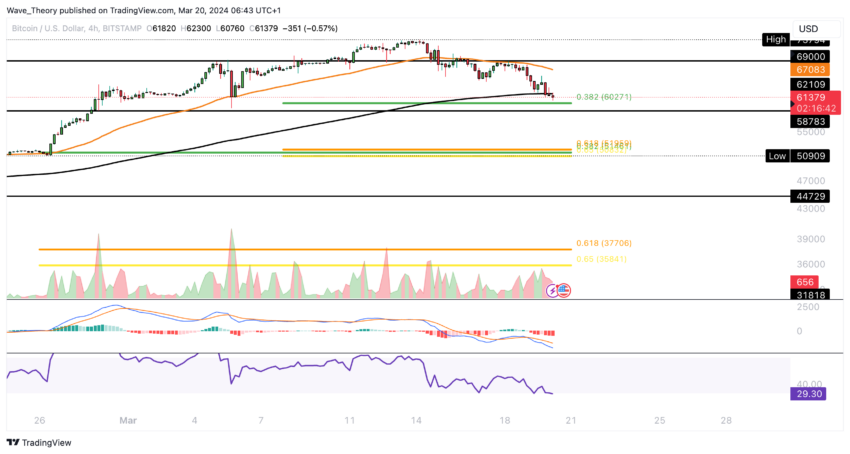
However, the EMAs maintain a golden crossing, suggesting a continued short-term bullish trend.
Bitcoin Dominance: Mixed Signals for Bulls and Bears
On the weekly chart, Bitcoin dominance is showing mixed signals, with the RSI indicating a bearish divergence and bearish crossed MACD lines. However, the MACD histogram alternates between bullish and bearish movements.
Read more: Bitcoin Price Prediction 2024/2025/2030
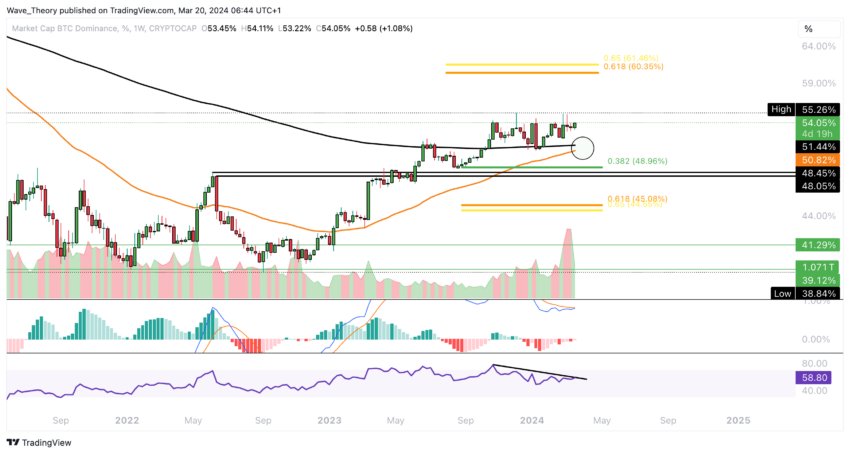
Moreover, the EMAs are approaching a bullish crossover, which will confirm a bullish trend in the medium term. Bitcoin Dominance resistance is significant at around 60.5%, while the next significant Fib resistance is around 49% to the downside.
Disclaimer
In accordance with the Trust Project Guidelines, this price analysis article is for informational purposes only and should not be construed as financial or investment advice. BeInCrypto is committed to accurate, unbiased reporting, but market conditions are subject to change without notice. Always do your own research and consult a professional before making any financial decisions. Please note that our terms and conditions, privacy policy and disclaimers have been updated.
Disclaimer for Uncirculars, with a Touch of Personality:
While we love diving into the exciting world of crypto here at Uncirculars, remember that this post, and all our content, is purely for your information and exploration. Think of it as your crypto compass, pointing you in the right direction to do your own research and make informed decisions.
No legal, tax, investment, or financial advice should be inferred from these pixels. We’re not fortune tellers or stockbrokers, just passionate crypto enthusiasts sharing our knowledge.
And just like that rollercoaster ride in your favorite DeFi protocol, past performance isn’t a guarantee of future thrills. The value of crypto assets can be as unpredictable as a moon landing, so buckle up and do your due diligence before taking the plunge.
Ultimately, any crypto adventure you embark on is yours alone. We’re just happy to be your crypto companion, cheering you on from the sidelines (and maybe sharing some snacks along the way). So research, explore, and remember, with a little knowledge and a lot of curiosity, you can navigate the crypto cosmos like a pro!
UnCirculars – Cutting through the noise, delivering unbiased crypto news


