Today’s on-chain analysis looks at the Realized Loss indicators to determine what stage of a bear market bitcoin (BTC) price is in. Specifically, realized loss and net realized gain/loss.
The realized loss today is comparable to the absolute price lows of BTC in 2014 and 2018. Moreover, these values have even been exceeded in some cases. This in turn suggests that it is possible that bitcoin has already bottomed out or is very close to doing so.
BTC realized loss
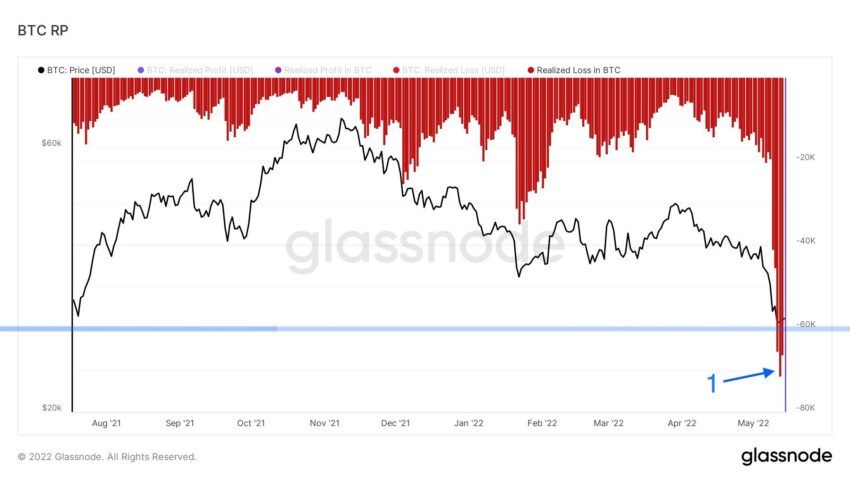
Realized loss indicates the total loss (expressed in dollars) of all moved coins whose price at their last move was higher than their price at their current move.
In absolute numbers for this indicator, we see that the seven-day simple moving average (7D SMA) reached its second highest level in history yesterday. It was only surpassed by the May 2021 crash, when bitcoin fell from the $59,000 level to a low of $30,000 in a matter of days.
Although the current drop is not as sharp – from $40,000 to $26,700 – the amount of realized loss is comparable.
Chart by Glassnode
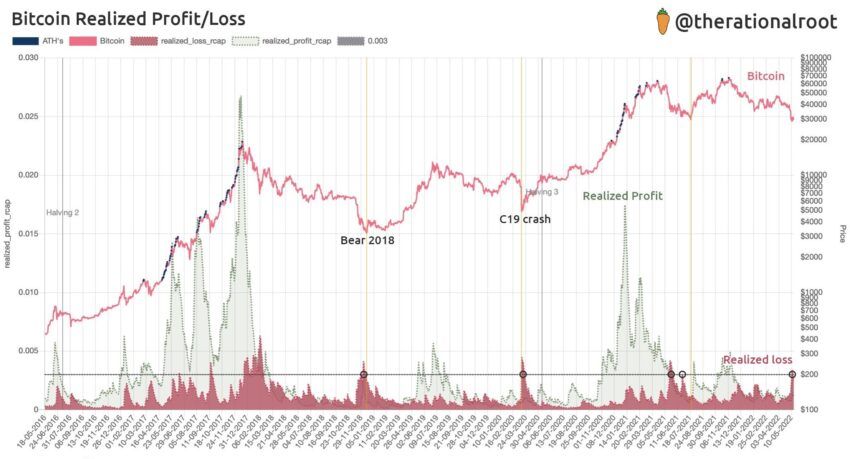
On a long-term chart of realized loss, one can see another argument that on-chain data indicates an impending bear market bottom. In a tweet yesterday, on-chain analyst @therationalroot published a chart of realized loss and gain relative to market cap.
He then marked a horizontal line (black) on it, where the realized loss peaked at previous lows in the bitcoin price. The ongoing capitulation appears to be comparable to investor behavior from the end of the December 2018 bear market, the March 2020 COVID-19 crash, and the aforementioned May 2021 decline.

Source: Twitter
However, the analyst emphasizes that today’s macroeconomic situation is different and there is a danger that the declines will continue. Therefore, he concludes by asking the question: “Will bitcoiners stand the test of time?”
BTC net realized profit/loss
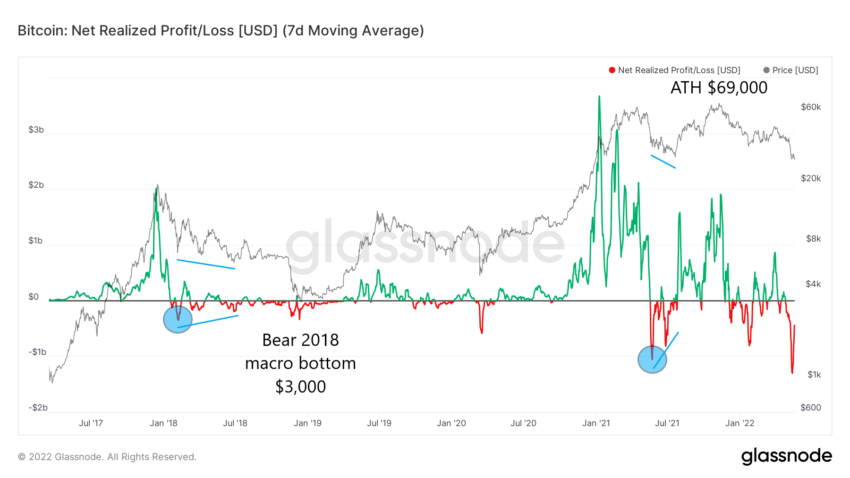
Additional insight into bitcoin’s market situation is provided by the related Net Realized Profit/Loss indicator. This is a graph of the net profit or loss of all moved coins, determined by the difference between realized profit and realized loss.
Looking at the long-term view of this indicator, we see that its 7D SMA has just reached an all-time low (ATL) at -$1.28 billion. However, if you look at historical data, this does not necessarily mean a bottom for the BTC price at all.
For example, the previous ATLs of net realized gain/loss were reached in February 2018 and May 2021 (blue circles). In both cases, this was caused by a sharp drop in the bitcoin price.
However, the price later recorded lower levels, even though the indicator did not fall that low anymore. Over a period of several months, a bullish divergence appeared (blue lines).

Chart by Glassnode
Moreover, such a bullish divergence only in the second case led to a significant bottom and a rise in the BTC price in July 2021 after the new ATH. On the other hand, in June 2018, there was indeed a local bottom for bitcoin near $6,000. However, after a short-term upward trend, the price collapsed and reached an absolute low near $3,000 in December 2018.
Two styles of realized loss: 2014 and 2018
Another popular cryptocurrency analyst @SwellCycle offered a similar analogy on Twitter to the previous bear market lows of 2014 and 2018. He showed how the realized loss (expressed in BTC, not USD) matched the bottom of the bitcoin price.
At the end of the bear market in 2014, all it took was one wave to coincide with bitcoin’s macro bottom. In contrast, in 2018, it was only the second wave of a realized loss that led to an absolute bottom in the BTC price. In today’s market conditions, the first wave has just occurred.

Source: Twitter
Are we in for a second wave and an even lower BTC price than $26,700? The analyst replies: “On closer inspection, I would say that both 2014 and 2018 style outcomes have similar probability.”
So, if the 2014 scenario were to repeat itself, the bitcoin price has already reached a bottom. However, if, similar to 2018, we are in another wave of big market loss realizations, BTC could dive even further south. The latter scenario is in line with the net realized profit/loss ratio, where we do not yet see a bullish divergence.
For Being[In]Crypto’s latest Bitcoin (BTC) analysis, click here.
Disclaimer
In accordance with the Trust Project Guidelines, this price analysis article is for informational purposes only and should not be construed as financial or investment advice. BeInCrypto is committed to accurate, unbiased reporting, but market conditions are subject to change without notice. Always do your own research and consult a professional before making any financial decisions. Please note that our terms and conditions, privacy policy and disclaimers have been updated.
Disclaimer for Uncirculars, with a Touch of Personality:
While we love diving into the exciting world of crypto here at Uncirculars, remember that this post, and all our content, is purely for your information and exploration. Think of it as your crypto compass, pointing you in the right direction to do your own research and make informed decisions.
No legal, tax, investment, or financial advice should be inferred from these pixels. We’re not fortune tellers or stockbrokers, just passionate crypto enthusiasts sharing our knowledge.
And just like that rollercoaster ride in your favorite DeFi protocol, past performance isn’t a guarantee of future thrills. The value of crypto assets can be as unpredictable as a moon landing, so buckle up and do your due diligence before taking the plunge.
Ultimately, any crypto adventure you embark on is yours alone. We’re just happy to be your crypto companion, cheering you on from the sidelines (and maybe sharing some snacks along the way). So research, explore, and remember, with a little knowledge and a lot of curiosity, you can navigate the crypto cosmos like a pro!
UnCirculars – Cutting through the noise, delivering unbiased crypto news


