

This section describes the experimental flow. First, data for the experiment was collected. Next, preprocessing was performed to eliminate irrelevant textual data. Third, technical indicators are derived from the S&P 500 dataset, with sentiment scores generated from ESG-related news data. After combining the processed data, the scaled data was adjusted as input data for the deep learning models to predict future prices. Finally, MAPE was used as the assessment measure for regression performance. In addition, ablation tests were performed to evaluate the effectiveness of each input feature. The experimental procedure is shown in Fig. 1 illustrated.
Flow chart for forecasting S&P 500 index.
Data Collection
The S&P 500 index is used to understand and monitor the overall trends of the stock market and is considered one of the indicators representing the health of the United States financial markets26. The S&P 500 represents an index of 500 major US companies, it reflects market-wide movements rather than individual company share prices. In addition, the S&P 500 includes companies from a variety of industries and sectors. Therefore, building a stock price prediction model that incorporates data from multiple industries is equivalent to designing a general model with versatility. Moreover, while stocks of individual companies must also consider the influence of internal factors, the S&P 500 is influenced by the overall market perception27. Hence, building an improved stock price prediction model by integrating ESG information and the S&P 500 can underscore the importance and impact of sustainability information across the market for investors and relevant researchers.
The experiments were conducted by collecting two datasets spanning from January 1, 2016 to July 31, 2023. Through LexisNexis, the authors accessed and collected a collection of 14,049 news articles using the search term “ESG.” Access to the LexisNexis database may require a paid subscription, such as institutional access. In addition, historical data on the S&P 500 index, which includes information such as date, close value, open value, high value, low value, trading volume and volatility, was obtained from investing.com for the same periods.
Function engineering
Based on previous research, the authors obtained several technical indicators that have proven to influence stock prices using the TA-lib module28,29. The selected features were open price, close price, high price, low price, trading volume, RSI, SMA_5, SMA_20, EMA, MACD, signal, Stochastic RSI_fastk, Stochastic RSI_fastd, Stochastic Oscillator Index_slowk, Stochastic Oscillator Index_slowd, Stochastic Oscillator Index_slowd, Stochastic Oscillator Oscillator, Stochastic Oscillator Oscillator , Momentum and ROC. Detailed descriptions of these technical indicators are provided below.
The opening price is the price of a share at the beginning of a trading session and indicates the first transaction made for the day. High prices represent the highest value of a stock trade within a specific trading period, while low prices indicate the lowest. Trading volume, which reflects market activity, is the number of shares or contracts traded during a specific period.
The RSI is a momentum oscillator that measures the speed and change in price movements and helps identify overbought or oversold conditions. SMAs are average closing prices over a specified number of time periods. For example, SMA_5 and SMA_20 represent the 5-day and 20-day moving averages, respectively. The EMA responds better to recent price changes by assigning more weight to them30.
MACD is a momentum indicator that follows trends by illustrating the interaction between two moving averages of a security’s price. Signal lines, i.e. the moving averages derived from MACD lines, play an important role in generating valuable buy and sell signals for traders and investors31.
Stochastic RSI_fastk and Stochastic RSI_fastd calculate based on both the RSI and stochastic oscillator, effectively grasp potential points of price reversal and improve the accuracy of predictions32. To ensure smoothness, the stochastic oscillator indices_slowk and stochastic oscillator indices_slowd were considered complementary components of the stochastic oscillator.
Another integral aspect of the analysis was William’s %R, commonly referred to as Williams R. This momentum indicator determines whether market conditions indicate overbought or oversold scenarios, thereby contributing to a comprehensive understanding of market sentiment33.
Next indicators used are momentum. The concept of momentum can be used to measure the rate of price change. Momentum provides insights into the rate at which prices change by quantifying the rate of change in stock prices. Finally, the ROC, a measure similar to momentum, involves the calculation of changes in prices over a specific period, which provides insight into the magnitude of price fluctuations34.
Sentiment Index Calculation Using Financial Bidirectional Encoder Representations from Transformers (FinBERT)
Preprocessing, including stopword removal and lemmatization, was performed on the news data, followed by sentiment analysis using FinBERT. FinBERT is built on the BERT architecture, which is an effective language model for natural language processing and understanding by encoding text by considering context bidirectionally35. FinBERT specializes in domain knowledge by retraining BERT’s pre-trained model with financial data. FinBERT takes financial related texts such as financial news, reports and web posts as input, and analyzes and predicts the sentiment of the text, categorizing it as either positive, negative or neutral.
The scores in the data are labeled 0 for negative sentiments and 1 for positive sentiments (Eq. (1)). Referring to a study by Wu et al.36, sentiment measures were calculated as the difference between the number of negative and positive posts in a specific data set.
$$Sentiment\, score=\frac{{M}_{tpos}-{M}_{tneg}}{{M}_{tpos}+{M}_{tneg}}$$
(1)
where \({M}_{tpos}\) represents the number of positive news articles and \({M}_{tneg}\) represents the number of negative articles on day t. The range of values for the sentiment index was between -1 and 125. If the sentiment index value approaches -1, it indicates a negative tone in the news for that date. Conversely, if it approaches 1, it indicates an overall positive tone in the news. Before using the selected features as input to the framework, a min-max scaler was applied to standardize the range of these values between 0 and 1.
Window size
Next, several datasets are generated, each corresponding to a distinct hyperparameter window. Window size is a fundamental concept in stock price forecasting for processing and forecasting time series data37,38. The window size defines a fixed unit period, with the data within this window used to predict future stock prices. Therefore, choosing an appropriate window size is crucial to improve the performance of stock price forecasting models. In this study, experiments were conducted using three window sizes: 3, 4 and 5 (Fig. 2). Finally, the training and test datasets were split at an 8:2 ratio. The validation dataset consists of 20% of the training dataset.
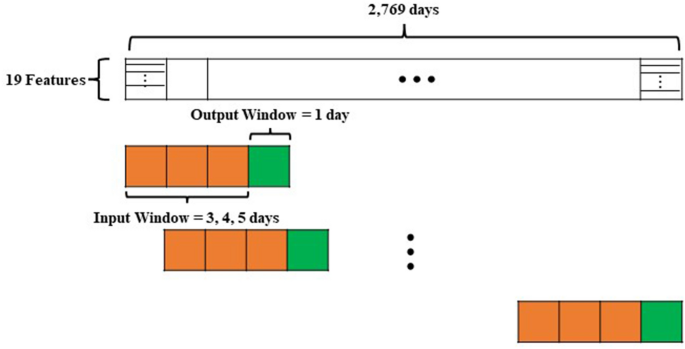
Window size illustration.
Deep learning models
Bidirectional Recurrent Neural Networks (Bi-RNN) is a type of recurrent neural network capable of considering both the preceding and following contexts of a sequence. This bidirectional property enables them to capture patterns in different temporal directions39. Furthermore, since short-term factors can affect the fluctuation in stock prices, the RNN structure with recurrent layers is adept at capturing these changes, making it suitable for application as a time series model. Moreover, Bi-RNN has a flexible structure that can be applied to different types of time series data, which makes it useful for processing patterns. In contrast, bidirectional long-short-term memory networks (Bi-LSTM) represent an improved iteration of RNNs that incorporate LSTM cells40. They excel at learning long-range dependencies and are particularly effective in tasks involving sequential data, such as time series forecasting41.
Disclaimer for Uncirculars, with a Touch of Personality:
While we love diving into the exciting world of crypto here at Uncirculars, remember that this post, and all our content, is purely for your information and exploration. Think of it as your crypto compass, pointing you in the right direction to do your own research and make informed decisions.
No legal, tax, investment, or financial advice should be inferred from these pixels. We’re not fortune tellers or stockbrokers, just passionate crypto enthusiasts sharing our knowledge.
And just like that rollercoaster ride in your favorite DeFi protocol, past performance isn’t a guarantee of future thrills. The value of crypto assets can be as unpredictable as a moon landing, so buckle up and do your due diligence before taking the plunge.
Ultimately, any crypto adventure you embark on is yours alone. We’re just happy to be your crypto companion, cheering you on from the sidelines (and maybe sharing some snacks along the way). So research, explore, and remember, with a little knowledge and a lot of curiosity, you can navigate the crypto cosmos like a pro!
UnCirculars – Cutting through the noise, delivering unbiased crypto news


