

If you are going to trade crypto, you need to do technical analysis to achieve consistent results.
You need to do some calculations to predict price movement when trading. Trading becomes a gamble when all you do is place a buy or sell order based on intuition or guesswork, and one of the important things traders do to get information about what is happening in the market is technical analysis .
So what is technical analysis, and what tools and indicators do you need to perform it?
What is Technical Analysis?
Technical analysis involves the use of mathematical indicators to evaluate statistical trends to predict price direction in the crypto market. This is done by looking at past price changes and volume data to determine how the market is working and predict how it will affect future price changes.
Technical analysis methods evaluate crypto markets and identify trading opportunities through price trends and patterns seen on charts. They are based on the belief that a crypto’s past trading activity and price changes are valuable indicators for determining future price and activity.
Three basic assumptions behind technical analysis
Technical analysis is based on three assumptions, and we will look at them briefly in this section.
1. The market reduces itself
This assumption holds that everything in the market that can affect the price of crypto is reflected in its price. The price shows you everything you need to know about a crypto asset. You don’t need to consider the fundamental factors affecting a crypto-asset to determine its price movements.
For example, say you notice that a crypto-asset’s price is falling. You can use the information in the chart, such as the candlestick pattern, the extent of the price drop and other technical information to know if it is best to invest in such a coin at such a time.
2. Price moves in a trend
Price action always shows trends, even in random market movements, regardless of the time frame you use. The green and red candlesticks show the trend pattern and direction of the price.
Prices are believed to follow a trend. A future price movement is more likely to follow an established trend. The price trend can be upward, downward or sideways (to the right).
3. History repeats itself
The repetitive nature of the crypto market means that analyzing past patterns can help you predict future market movements.
Market participants usually show consistent responses to market events over time. Although some chart patterns formed long ago, they are still considered important as they can happen again.
The following six tools and indicators are commonly used to perform technical analysis when trading cryptocurrencies.
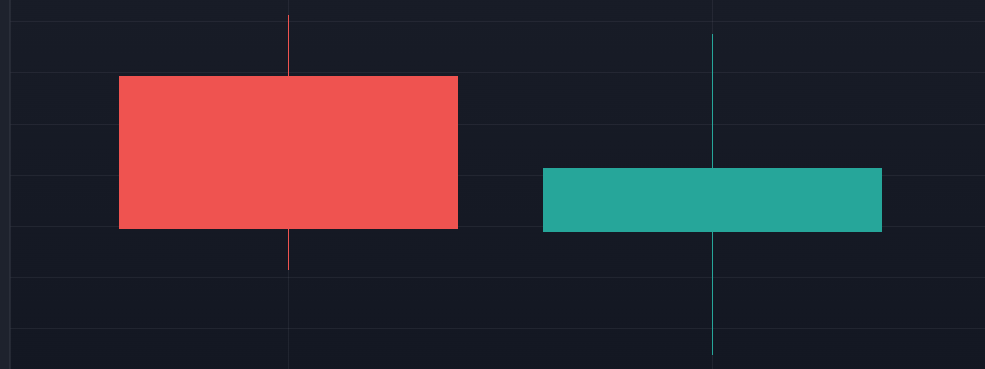
1. Candlestick chart
Traders prefer candlestick charts because they show more information about price movement. Each candlestick represents the activity around the time frame you choose for trade analysis. So, if you are working within a four-hour time frame, each candlestick will represent the price movement every four hours.
Candlesticks consist of a body and wick. The body can be either green (increasing) or red (decreasing).
Green candlesticks indicate that a trade has closed higher than its opening price. The base shows the opening price while the top shows the closing price. On the other hand, the red candlesticks show that the trade closed below the opening price. The candlestick’s wick shows how high and low the price was within the time frame—the peak of the upper wick shows the highest price, while the tip of the base wick shows the lowest transaction price.
2. Support and Resistance
Understanding support and resistance levels will help you easily interpret key chart levels. These are specific price levels that the market finds difficult to exceed. A support level is a point where prices stop moving lower, while resistance is the point where the market price cannot rise further.
The support level looks like the bounce-back spot for asset prices; once the market falls to that point, it picks back up. On the other hand, once the price rises to the resistance level, which acts as an upper barrier, it falls back.
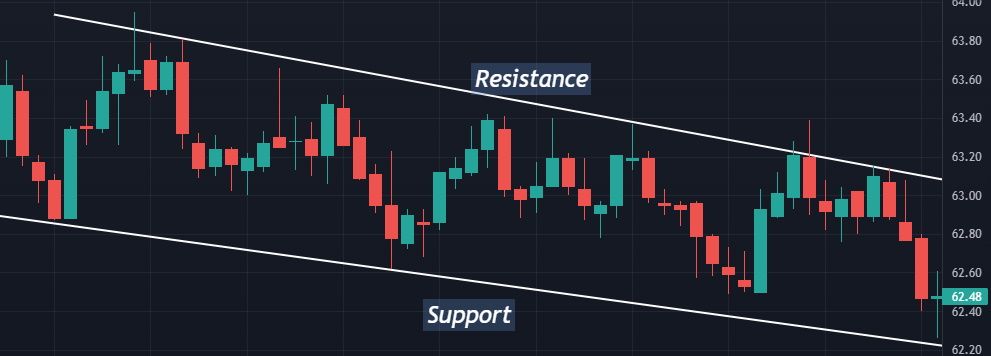
Once you identify these levels, you can use them to form your market price forecasts. The resistance is a point where a bullish push is most likely to stop, and the price will start falling again, while the support is the point where there is likely to be a bullish reversal (for a price rise).
3. Trend lines
These are used to chart potential trends in the market, and they take different forms. Traders also draw multiple trend lines to draw out more complex patterns. A trend line is a single line that connects different high and low price points. The more the price point joins the line, the stronger the trend.
4. Moving average
The indicator helps you track the price trend by taking the average of past prices of a crypto asset over a specified period of time. You can adjust the period to a suitable time frame to generate reliable signals in a real-time trading chart. Moving averages provide insights into market direction and help determine a good trade entry price.
There are two common types of moving average: the simple moving average, which averages total prices over a specified period of time, and the exponential moving average, which prefers the most recent prices without actually considering past price movements. The most commonly used moving averages are the 10, 20, 30, 50, 100 and 200-day moving averages.
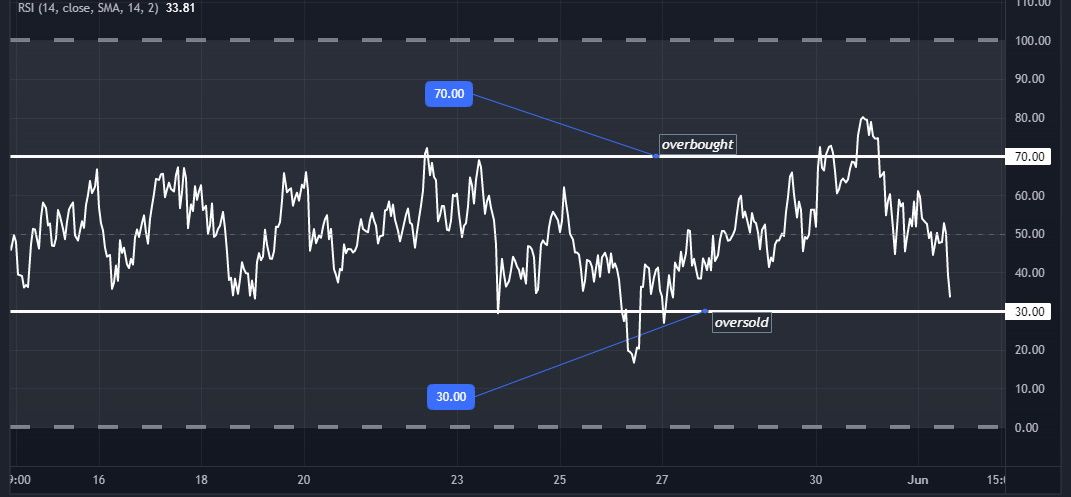
5. Relative Strength Index (RSI)
The RSI is an oscillating indicator that shows whether an asset is overbought or oversold. It measures in the range of 0 to 100. Once the RSI value of a crypto asset is below 30, it is oversold, and when the RSI value moves above 70, it indicates an overbought asset price. An overbought state is a potential sell signal, while an oversold state indicates a potential buying opportunity.
6. Bollinger Bands
This indicator also helps you measure the price movement of assets. The band is typically measured with a 20-day simple moving average by adding and subtracting a standard deviation from the moving average. Once the market price is above the upper Bollinger band, it indicates overbought, and if it is below the lower band, it is considered oversold.
Limitations of Technical Analysis
One of the main criticisms against technical analysis is that history does not repeat itself in exactly the same way, which makes technical analysis inaccurate. These critics believe that price patterns are not very useful.
Another criticism against technical analysis is that it only works in some cases and produces inconsistent results.
Technical analysis is also limited to studying chart patterns and market trends. This neglects the aspect of studying the way a crypto community works or other fundamental factors that affect the price.
Technical analyzes become relevant and informative only when the market moves in a certain way. It cannot predict movement which needs a fundamental background analysis.
Technical analysis is not enough
The above technical tools and indicators will be useful additions to your crypto trading strategy. Many traders rely on technical analysis to make trading decisions. In fact, some only believe in technical analysis. However, the combination of technical and fundamental analysis is considered a more rational approach to trading.
Technical analysis gives information about market trends, especially short-term trends, while fundamental analysis usually gives information that can guide your long-term investment strategies. Doing fundamental analysis will also make you aware of short-term market sentiments. A combination of technical and fundamental analysis will give better trading results.
Disclaimer for Uncirculars, with a Touch of Personality:
While we love diving into the exciting world of crypto here at Uncirculars, remember that this post, and all our content, is purely for your information and exploration. Think of it as your crypto compass, pointing you in the right direction to do your own research and make informed decisions.
No legal, tax, investment, or financial advice should be inferred from these pixels. We’re not fortune tellers or stockbrokers, just passionate crypto enthusiasts sharing our knowledge.
And just like that rollercoaster ride in your favorite DeFi protocol, past performance isn’t a guarantee of future thrills. The value of crypto assets can be as unpredictable as a moon landing, so buckle up and do your due diligence before taking the plunge.
Ultimately, any crypto adventure you embark on is yours alone. We’re just happy to be your crypto companion, cheering you on from the sidelines (and maybe sharing some snacks along the way). So research, explore, and remember, with a little knowledge and a lot of curiosity, you can navigate the crypto cosmos like a pro!
UnCirculars – Cutting through the noise, delivering unbiased crypto news


