
.png?1708056537 "Build a DEX Tracker with Streamlit and Python")
[ad_1]
In this tutorial, we will explore how to connect to CoinGecko API to query on-chain, decentralized exchange (DEX) data to create a DEX tracker using Streamlit and Python.
Our on-chain endpoints provide access to real-time price and liquidity data for 2M+ tokens across 100+ blockchains – this includes cryptocurrencies not yet listed on CoinGecko. Retrieve information such as new crypto pools, price changes and transaction volumes, which are crucial for tracking the performance of different cryptocurrency pairs on DEXs.
What is Streamlit?
Streamlit is an open source Python library that allows you to easily build interactive, shareable web applications for your data projects. It is designed for people with some Python programming experience. Used by many data scientists, machine learning engineers, and backend developers, Streamlit accelerates the process of creating beautiful data-driven applications without the need for extensive front-end development skills.
What is a DEX Tracker?
A DEX tracker is a tool or application that monitors and provides insight into the trading activities that occur on decentralized exchanges. It can display various metrics, including liquidity, volume, price changes, and more, helping traders make informed trading decisions. CoinGecko’s sister product, GeckoTerminal, is an example of a DEX tracker.
Prerequisites
Before we get to the code snippets, let’s look at the prerequisites for building a DEX tracker:
A Basic Understanding of Python – Python is a programming language known for its ease of use, powerful data manipulation libraries, and strong community support. Streamlit – We will use this App Starter Kit to bootstrap our dashboard. CoinGecko API Paid Subscription – We will call the API’s new /onchain endpoints to fetch live, on-chain data from DEXs, which is a paid exclusive endpoint. Make sure you have your Pro API key ready for authentication.
With that, let’s dive in!
How to Build a DEX Tracker in 5 Steps
Step 1. Setup
To get data about all the latest pools across all supported blockchain networks, we will query the /onchain/networks/new_pools endpoint. Such data can be especially useful for crypto traders to identify new tokens and projects entering the market, assess the risk associated with each liquidity pool and spot potential arbitrage opportunities.
💡 Pro tip: The equivalent page of this data on CoinGecko’s sister product, GeckoTerminal, is New Crypto Pools.
For this project, I suggest using a virtual environment to install and isolate your dependencies.
Step 2. Boiler plates
We used this to get started: https://github.com/streamlit/app-starter-kit
If you just want to copy the code directly, you can download this repo on GitHub for the fastest setup.
Step 3. Display + API Utilities
To retrieve and parse the API, you’ll first need to get the associated data, followed by parsing the raw JSON response into a format acceptable for streaming. In this example, we created a separate utils.py file to handle these different functions.
fetch_data is a generic decorated function for APIs.
process_data takes our newly captured API JSON response and turns it into a data frame.
get_top_changes specifically gets the top3 pairs with the biggest change in a particular column. In this example, we use price_change_percentage_h1
parse_crypto_pools is used to map the response to a flat format.
plot_price_change to plot the price changes in the last 24 hours
Here’s how it all comes together:
import json
input current lit as st
import requests
import pandas as pd
import matplotlib.pyplot as plt
import seaborn as sns
# Function to retrieve data from the API
@st.cache_data
def fetch_data(url, headers):
response = requests.get(url, headers=headers)
if response.status_code == 200:
return response.json()
else:
st.error(f’Failed to retrieve data. Status code: {response.status_code}’)
return None
# Function to process the JSON data into a DataFrame
def process_data(data):
return pd.DataFrame([pool[‘attributes’] for collecting data[‘data’]])
# Function to get top 3 pairs with the biggest volume change of 1 hour
def get_top_changes(df, column_name=”price_change_percentage_h1″):
# Make sure the column is of type float
df[column_name] = df[column_name].astype(float)
# Sort the DataFrame based on the volume change column
top_changes = df.sort_values(by=column_name, ascending=False).head(3)
# Include the ‘transactions’ column in the returned DataFrame
return top_changes[[‘name’, column_name, ‘transactions_h1_sells’, ‘transactions_h1_buys’]]
def parse_crypto_pools(json_payload):
# Convert the JSON payload to a Python dictionary
data = json_payload
# List to hold parsed pool data
parse_pools = []
# Iterate through each pool in the data
for collecting data[‘data’]:
# Extract relevant information from each pool
pool_info = {
‘address’: pool[‘attributes’][‘address’],
‘name’: pool[‘attributes’][‘name’],
‘pool_created_by’: pool[‘attributes’][‘pool_created_at’],
‘fdv_usd’: pool[‘attributes’].get(‘fdv_usd’),
‘market_cap_usd’: pool[‘attributes’].get(‘market_cap_usd’),
‘volume_usd_h1’: pool[‘attributes’][‘volume_usd’][‘h1’],
‘volume_usd_h24’: pool[‘attributes’][‘volume_usd’][‘h24’],
‘price_change_percentage_h1’: json.loads(pool[‘attributes’][‘price_change_percentage’][‘h1’]),
‘price_change_percentage_h24’: json.loads(pool[‘attributes’][‘price_change_percentage’][‘h24’]),
‘transactions_h1_buy’: pool[‘attributes’][‘transactions’][‘h1’][‘buys’],
‘transactions_h1_sale’: pool[‘attributes’][‘transactions’][‘h1’][‘sells’],
}
parsed_pools.append(pool_info)
return parsed_pools
def plot_price_change(df, log_scale=False):
pool_name = df[‘name’]
# Use the float values of the range directly
price_changes_24h = [float(change) if change else 0 for change in df[‘price_change_percentage_h1’]]
fig, ax = plt.subplots()
sns.barplot(x=’price_change_percentage_h1′, y=’name’, data=df, ax=ax)
ax.set(xlabel=”Price change percentage (24h)”, title=”Price change percentage (24h) by pool”)
back fig
4. Main Dashboard
For the main.py, we will reserve it for logic related to constants, UI configuration, and managing the main application.
input current lit as st
import pandas as pd
import numpy as np
from utils import fetch_data, get_top_changes, parse_crypto_pools, plot_price_change
# Constants
BASE_URL = ‘https://pro-api.coingecko.com/api/v3/onchain’
ENDPOINT = ‘/networks/new_pools?page=1’
API_URL = BASE_URL + ENDPOINT
HEADERS = {‘accept’: ‘application/json’, ‘x-cg-pro-api-key’:’INSERT_API_KEY_HERE’}
# Set the page to wide mode
st.set_page_config(layout=”wide”)
# Main program code
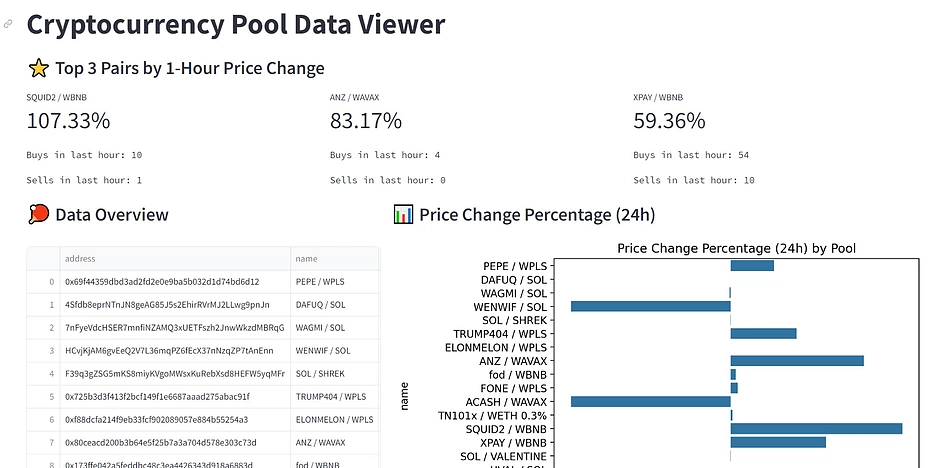
st.title(‘Cryptocurrency Pool Data Viewer’)
# Retrieve and process data
raw_data = fetch_data(API_URL, HEADERS)
if raw_data:
df = pd.DataFrame(parse_crypto_pools(raw_data))
top_volume_changes = get_top_changes(df, ‘price_change_percentage_h1’)
# Display the top 3 price changes
st.subheader(‘⭐️ Top 3 pairs with 1-hour price change’)
columns = st.columns(3) # Create three columns for the top 3 changes
for index, (column, row) in enumerate(zip(columns, top_volume_changes.iterrows())):
with dot:
st.metric(label=row[1][‘name’]value=f”{row[1][‘price_change_percentage_h1’]:.2f}%”)
st.text(f”Buy in last hour: {row[1][‘transactions_h1_buys’]}”)
st.text(f”Sold in last hour: {row[1][‘transactions_h1_sells’]}”)
# Create two columns for the data table and the bar chart
col1, col2 = st.columns([2,3])
with col1:
# Display data table in the first column
st.subheader(‘🏓 Data Overview’)
st.write(“”, df)
with col2:
# Visualization: Bar graph for percentage price change in the second column
st.subheader(“📊 Price change percentage (24h)”)
if ‘price_change_percentage_h1’ in df.columns:
fig_price_change = plot_price_change(df)
st.pyplot(fig_price_change, use_container_width=True)
The final result: Crypto Pools DEX Tracker on Streamlit
If you have configured your dependencies and code properly, you can now run streamlit run main.py in your terminal, after which the below dashboard should appear in your browser:
By following these steps, you can easily build a DEX dashboard to visualize on-chain data from decentralized exchanges. This guide serves as a foundation, and you can expand it by adding more features and interactivity.
Enhance your dashboard: 5 popular on-chain DEX API endpoints
For more details on improving your dashboard, you can refer to this Streamlit documentation, as well as other popular on-chain DEX data endpoints in CoinGecko API:
/networks/{network}/pools – Get top pools on a network /networks/{network}/trending_pools – Get trending pools on a network /networks/{network}/tokens/{token_address}/pools – Get top pools for a token /search/pools – Search for pool address, token address or token symbols on a network /networks/{network}/pools/{pool_address}/ohlcv/{timeframe} – Get the OHLCV graph (open, high, low, close , Volume) of a cryptopool based on a pool address on a network.
Although these endpoints are not yet available on CoinGecko API and will not be released until the end of February 2024, you can test them via GeckoTerminal API. They are also available on demand through our paid plan.

Interested in more how-to guides using CoinGecko API? Check out this walkthrough on how to build an artificial intelligence crypto chatbot.
Tell us how much you like this article!

Automation Architect
Automation Architech boasts a seasoned team specializing in ML-driven solutions, industrial engineering and digital product development. They are dedicated to ethical AI, bridging technological gaps and fostering creativity without sidelining humanity. Follow the author on Twitter @auto_architech
Read more from Automation Architech
[ad_2]
Disclaimer for Uncirculars, with a Touch of Personality:
While we love diving into the exciting world of crypto here at Uncirculars, remember that this post, and all our content, is purely for your information and exploration. Think of it as your crypto compass, pointing you in the right direction to do your own research and make informed decisions.
No legal, tax, investment, or financial advice should be inferred from these pixels. We’re not fortune tellers or stockbrokers, just passionate crypto enthusiasts sharing our knowledge.
And just like that rollercoaster ride in your favorite DeFi protocol, past performance isn’t a guarantee of future thrills. The value of crypto assets can be as unpredictable as a moon landing, so buckle up and do your due diligence before taking the plunge.
Ultimately, any crypto adventure you embark on is yours alone. We’re just happy to be your crypto companion, cheering you on from the sidelines (and maybe sharing some snacks along the way). So research, explore, and remember, with a little knowledge and a lot of curiosity, you can navigate the crypto cosmos like a pro!
UnCirculars – Cutting through the noise, delivering unbiased crypto news


