

Reading bitcoin charts is essential for traders looking to find the best market timing opportunities in the crypto markets. In this guide, you will learn about the most common bitcoin price charts and how to read them, and you will discover the most popular technical indicators that bitcoin traders use.
What is a Bitcoin Price Chart?
A Bitcoin chart is a visual representation of bitcoin’s historical price that shows price patterns that traders can use to identify bitcoin trading opportunities.
A Bitcoin chart has a horizontal and vertical axis that shows the corresponding timeframe and price of the digital asset. Bitcoin price movements can be discerned by examining bitcoin charts with various time frames, from minutes, hours, days, weeks, months to years. Bitcoin charts are used by traders and analysts to try to identify price trends to capitalize on.
How to Read Bitcoin Price Charts
Learning how to read bitcoin charts is essential for anyone who wants to trade the digital currency. To study price movements or trends from a bitcoin chart, you must first understand the different types of charts.
The three most common charts used by traders are line charts, bar charts, and candlestick charts. Let’s look at them.
Line graph
A line chart is a visual representation of an asset’s historical price activity depicted by a continuous line showing the asset’s closing price. In this graph, the horizontal (x) axis is the time scale, and the vertical (y) axis shows the price.
In a line graph, you can derive the price of bitcoin by connecting a data point to the (x) axis in a straight line and the date by connecting a data point to the (y) axis. Remember, each point in the line follows the daily (or weekly or monthly) closing price of bitcoin.
Bar chart
A bar chart is useful for tracking an asset’s daily price movements and is indicated by the vertical length of a bar. The horizontal lines show the daily opening and closing bitcoin prices. A bar chart goes further than a line chart, showing not only price fluctuations, but also the range of price movements and opening and closing prices.
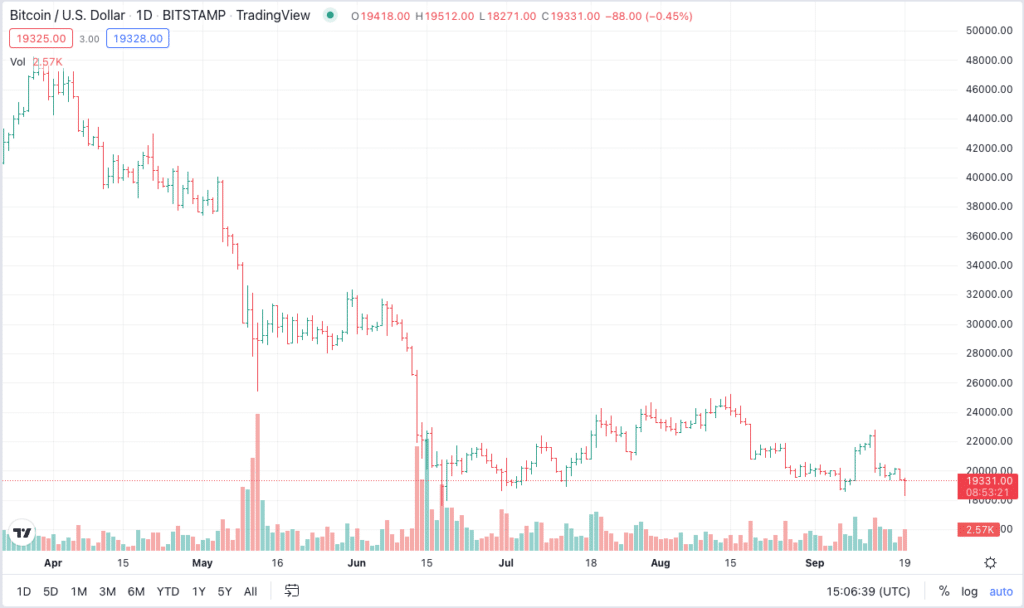
Candlestick chart
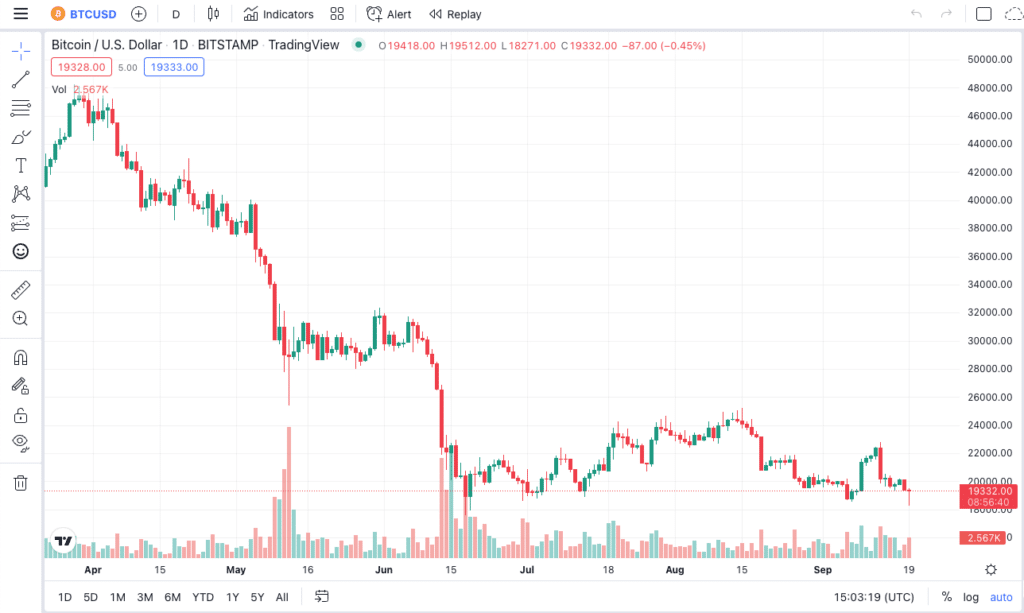
The most popular bitcoin chart out there is a candlestick chart. A candlestick chart uses candles to illustrate the price movement of bitcoin within a specific time frame. For example, if a bitcoin chart is set to a 4-hour interval, each candlestick represents 4 hours of trading.
A candlestick consists of a body and a wick. The body represents its opening and closing prices, with the fuse attached to the summit representing the maximum price of the digital currency during the period. The fuse attached to the base represents the minimum price of the asset within the chosen time frame.
A red candle indicates that the price of bitcoin has fallen, while a green candle shows that the price has appreciated. That said, candlestick charts form different patterns, and it is up to you as a trader to take a position depending on the shape, size and color of the candlesticks.
A hammer marker pattern can tell us that the digital currency is approaching the bottom of a downtrend. The body of the candle is short, representing the hammer, while the long pips indicate that sellers are driving prices low during a certain trading period. This is known as a bullish reversal pattern which is supposed to indicate that once bitcoin bottoms out, buyers can cause buying pressure, which will drive the price upwards.
A shooting star candle is used to describe a pattern that occurs at the peak of a rally before a reversal kicks in and the price begins to decline. This is also known as a bearish reversal pattern. This formation is represented by a candle with a long upper wick and a small body.
Top Bitcoin Chart Analysis Indicators
Now let’s look at some of the most popular chart analysis indicators that bitcoin traders like to use.
Bollinger Bands
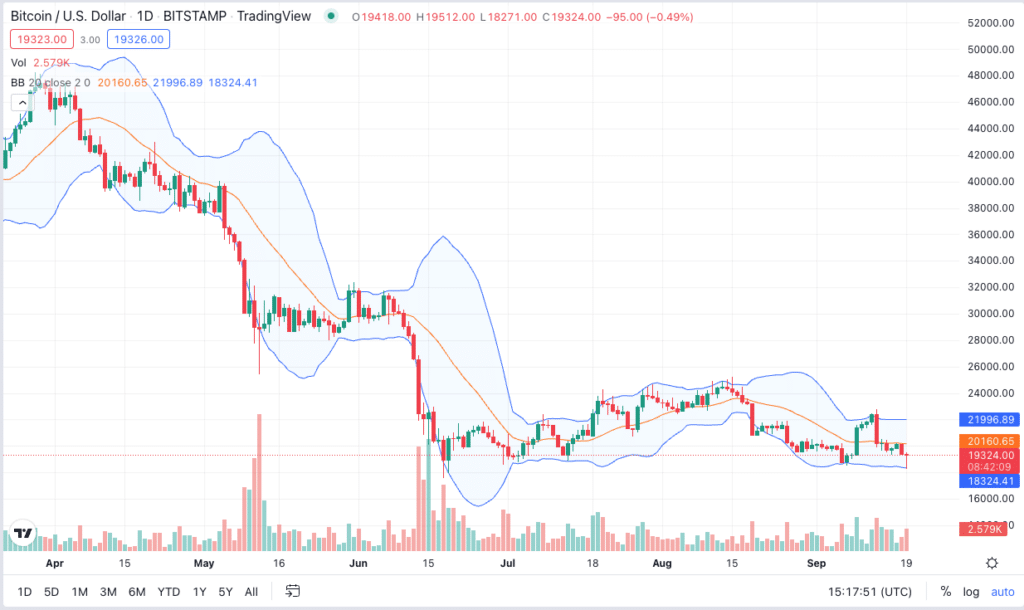
Bollinger Bands can help traders identify short-term movements in the price of bitcoin (BTC). The bands indicate periods of high and low volatility and are used in conjunction with other indicators. Bollinger band parameters can be adjusted to accommodate the highs and lows of bitcoin’s prices and the trader’s time preference.
When the price of bitcoin moves beyond the upper band, it is considered overbought. If it moves below the lower band instead, the cryptocurrency is considered oversold.
RSI
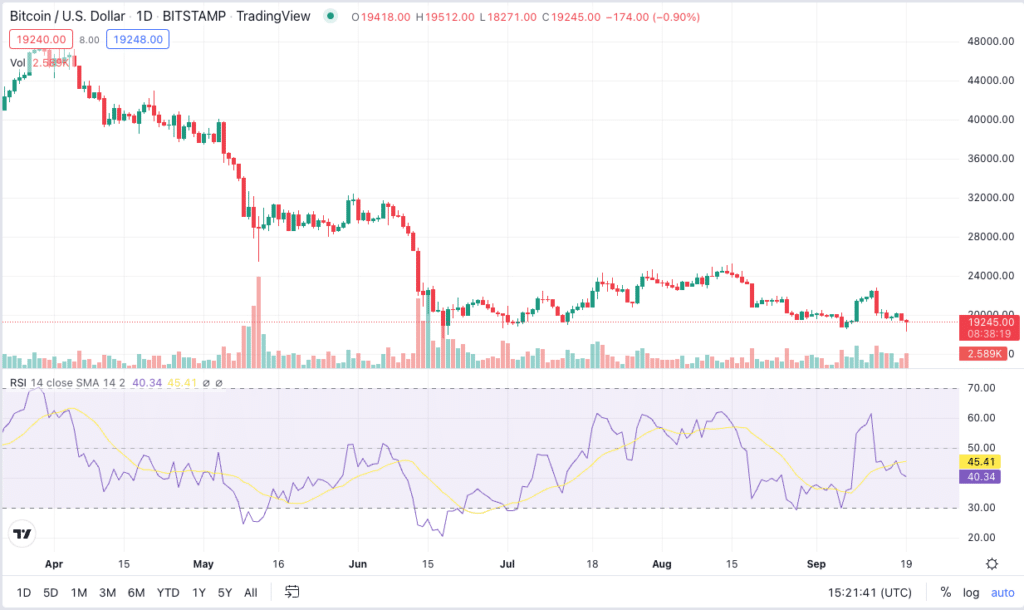
The Relative Strength Index (RSI) is a momentum indicator that measures whether a digital asset is overbought or oversold. The index is represented as a line between two opposites and can range from 0 to 100.
The index typically uses a 14-day time interval for a digital asset to be considered oversold when its value falls to 30 and overbought when its value appreciates to 70. In other words, if the line moves up, (overbought), then the price may soon fall, but if the line moves down (oversold), the price may soon rise.
MACD
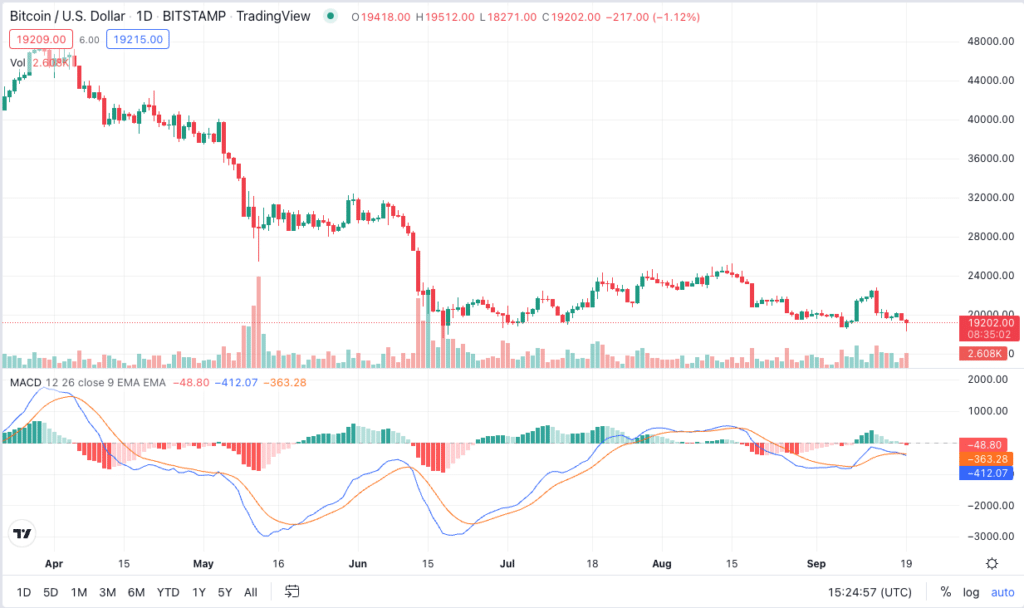
Moving Average Convergence Divergence (MACD) is a trend-following momentum indicator that aims to provide insights into the future price of an asset based on price movements.
MACD consists of three numbers. The first number indicates the number of periods used to calculate a faster moving average. The second indicates the time periods used to calculate a slower moving average. The final number represents the number of bars used to calculate the average of the amount by which the results of the first two numbers differ.
The intersection of the faster-moving average and the slower-moving average is known as a convergence. On the other hand, the scenario where the faster moving average deviates from the slower moving average is known as a divergence.
Movements in the MACD indicator can show overbought and oversold levels and possible trend reversals.
Is technical analysis a good approach to investing in Bitcoin?
Technical analysis involves taking bitcoin’s past trading patterns and price volatility in an attempt to determine where the market will go next. It works under the assumption that the market is fully efficient when pricing an asset. All past and present information is considered the basis of bitcoin’s current value.
However, no chart indicator or technical analysis strategy can accurately predict where price will go next. So focusing purely on charts is probably not a good approach to investing in bitcoin. Also, technical analysis is more of a short-term trading tool than a long-term investment approach.
As a result, most traders typically use chart analysis to identify entry and exit levels, as opposed to as a standalone tool for making investment decisions.
Frequently Asked Questions
What are support and resistance lines?
Support and resistance lines are represented on a bitcoin price chart using trend lines. A trendline is illustrated on a chart by connecting a series of price data points. A support level is a point at which the price of a crypto-asset stops falling due to a concentration of buying interest at that level. Resistance lines are drawn through various points where the price rises and sellers jump in, leading to a condition where the crypto-asset struggles to go higher for the time being.
What is a moving average?
A moving average (MA) aims to smooth out price volatility to spot a general trend. The idea is to plot multiple data points and average them. The final value is then plotted on a graph. A trader can use MAs and set them to any time interval they desire. However, many traders believe that long-term MAs are more useful as they carry more data.
Is technical analysis the same for stocks and crypto?
Technical analysis can be applied to both stocks and crypto. The difference between stocks and the crypto market is that digital assets are generally more volatile.
Disclaimer for Uncirculars, with a Touch of Personality:
While we love diving into the exciting world of crypto here at Uncirculars, remember that this post, and all our content, is purely for your information and exploration. Think of it as your crypto compass, pointing you in the right direction to do your own research and make informed decisions.
No legal, tax, investment, or financial advice should be inferred from these pixels. We’re not fortune tellers or stockbrokers, just passionate crypto enthusiasts sharing our knowledge.
And just like that rollercoaster ride in your favorite DeFi protocol, past performance isn’t a guarantee of future thrills. The value of crypto assets can be as unpredictable as a moon landing, so buckle up and do your due diligence before taking the plunge.
Ultimately, any crypto adventure you embark on is yours alone. We’re just happy to be your crypto companion, cheering you on from the sidelines (and maybe sharing some snacks along the way). So research, explore, and remember, with a little knowledge and a lot of curiosity, you can navigate the crypto cosmos like a pro!
UnCirculars – Cutting through the noise, delivering unbiased crypto news


