

To be a successful trader within the cryptocurrency market, traders must be able to spot certain market trends before they develop. To achieve this, they must rely on two types of analysis. The first is fundamental analysis, which relates to market sentiment and the factors that influence it. The second is technical analysis, which focuses on an asset’s price and volume.
Usually, technical analysis involves detecting chart patterns that can indicate what will happen next. A death cross is a common technical analysis pattern that usually heralds the start of a bear market or downtrend. This guide will explain what a death cross is, what it tells you, and how to spot one.
What is a death cross?
To understand what a death cross is, we must first explain moving averages (MAs). A moving average is a line plotted across a price chart. It measures the average price of an asset over a specific period of time. For example, a 50-day moving average measures the average price of a cryptocurrency over the past 50 days. While moving averages are a commonly used tool within crypto technical analysis, they actually come from other financial markets.
We can start to notice patterns based on moving averages when we look at the cryptocurrency price chart. For example, when a short-term MA crosses below a long-term MA, it tends to apply downward pressure on the price action. This particular setup is known as a death cross.
What do death crosses say to you?
The death cross is a sign that the bull market or an uptrend is coming to an end. The death cross is generally considered a bearish sign, and has historically appeared many times before major economic downturns.
This is why traders tend to rely on death crosses to predict market trends. It is a very useful technical analysis tool as it indicates when a bull market is coming to an end. This is often considered the time to sell and close positions before the price drops.
How to spot a death cross
There are usually three phases to a death cross.
The run-up
The first phase is when the price action consolidates after a big upswing. Sometimes it can break out and continue to rise. However, the price takes a sharp turn in most scenarios and starts to fall. This is the period of consolidation, and it is the first clue that a death cross is on the horizon. During this stage, the 50-day MA is still above the longer-term 200-day MA.
The Death Cross
The second stage is when the death cross actually takes place. This is the point where the short-term MA crosses below the long-term MA. This creates a bearish backdrop for the market and traders get scared. It is also worth pointing out that this can also serve as an opportunity as certain traders decide to short the market at this point.
The Downward Swing
The third and final stage of the death cross is the downward swing. This is when price action continues to head lower after the two moving averages diverge. Depending on the market structure, the short-term MA can also act as a resistance point for the asset.
Are death crossings reliable?
While death crosses sound useful for traders, they have their drawbacks. One of the disadvantages is that dead crossings can provide false signals. In 2016, a market crash occurred, and investors were prepared for the worst. However, the market trends did not change as expected. Therefore, a death cross can be reliable, but it does not always play out as traders expect.
Pros and cons of analyzing death cross patterns
Just like all the other indicators/trading strategies out there, death crosses have their pros and cons, for example:
Advantages
Acts as an indicator of a long-term market trend change Can help manage volatility Easy to spot and use to your advantage
Disadvantages
Sometimes provides false signals Recommended to use with other indicators Lagging indicator
As you can see, the death cross has its advantages and disadvantages. It has become an increasingly popular tool to use thanks to the success rate in the Bitcoin chart. The death cross has appeared several times in Bitcoin’s chart. Every time to date the price has fallen after the cross has made an appearance. Traders who have adjusted their trading strategies to include the death cross have avoided major price crashes. A death cross is also easy to understand, identify and use.
On the other hand, no technical indicator is perfect. The death cross may have a decent track record, but it still comes with some flaws. Technical traders sometimes refer to it as the lagging indicator. As the native price action tends to occur before the death cross.
Examples of dead cross trading strategies
There are several trading strategies that revolve around death crossings. Combining the death cross with other indicators is of course the most effective way to use it. Regardless of the accuracy that death crosses have shown, it is not recommended to make a move based on one indicator.
Here are some examples of how you can combine the death cross with other indicators to elevate your trading strategy.
An increase in volume
Once you suspect that a death cross may occur, you can check another indicator – trading volume. If the volume is high when the death cross starts to form, it is statistically proven to be a more reliable bear market signal, as high volume indicates that a significant trend reversal is coming.
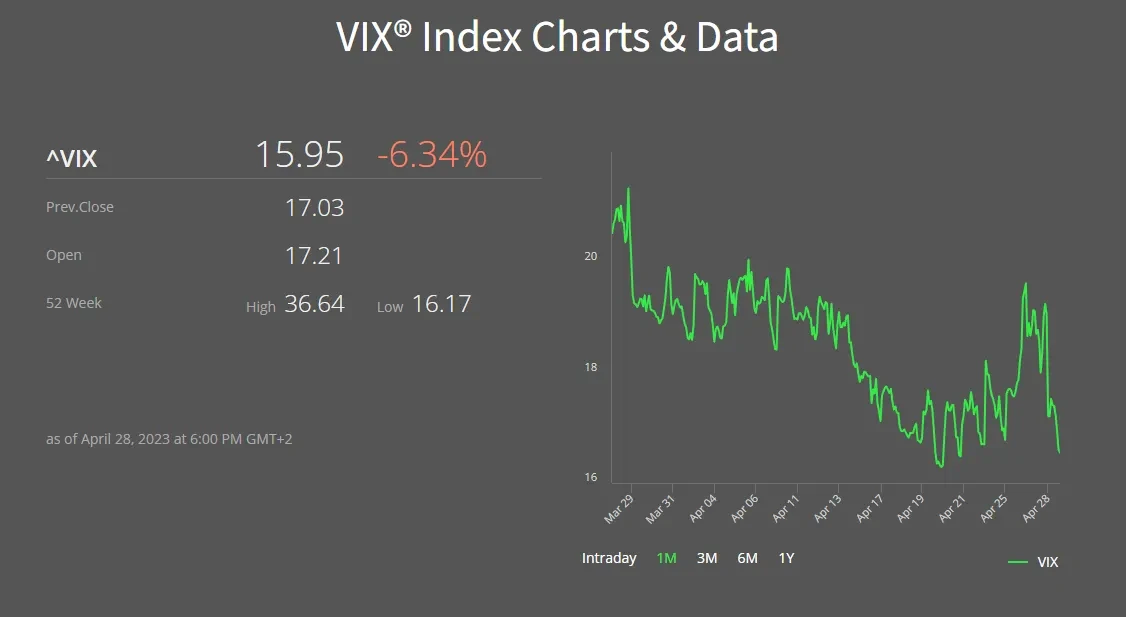
The fear index
The CBOE created a volatility index (VIX), otherwise known as the fear index, that measures fear in the market. This can provide a useful insight into how investors feel at any given time. Fear is considered high if the fear index’s score is above 20. If it were to reach 30, and you have identified a death cross, the possibility of a price correction increases significantly.
The RSI
The relative strength index indicator, or RSI, is another important tool that you can combine with a death cross. The RSI measures whether an asset is overbought or oversold. If you see that the asset is overbought and you identify a death cross, the price is likely to reverse.
Check the MACD
Since death crosses depend on moving averages, the MACD is a tool you cannot avoid. Known as the moving average convergence divergence indicator, the MACD shows whether a trend is losing momentum or just gaining. It can also give you an insight into whether the market is bearish or bullish.
Death Cross in Crypto: The Final Verdict
Technical analysis is not simple, but it can be very useful if you understand it. It can help you make reliable predictions and warn about upcoming market changes. Given how volatile the crypto market can be, spotting trend reversals as quickly as possible is crucial.
Death crosses have always appeared before major declines. Sometimes they can appear without the price drop. There are even cases where they appeared after a drop occurred. However, any hint of an upcoming bear trend is helpful.
Frequently Asked Questions
What is a death cross in crypto?
A death cross is a sign that the market is about to turn bearish. This happens when the short-term moving average crosses below the long-term moving average. This is a sign that the price is about to drop.
Is the death cross good or bad?
A death cross is neither good nor bad. This is a market opportunity that you can identify and use to your advantage. By knowing what’s coming, you can prepare for it and take steps to trade effectively.
Is a death cross clumsy?
Yes, a death cross is a sign that the bear market is approaching. However, there were cases where the bear wave did not arrive after a death cross. This is why some believe that the correct predictions were purely coincidental.
How long does a death cross last?
A death cross follows two lines – a 200-day MA and a 50-day MA. Since these are longer time frames, they are not affected by short-term volatility.
Disclaimer for Uncirculars, with a Touch of Personality:
While we love diving into the exciting world of crypto here at Uncirculars, remember that this post, and all our content, is purely for your information and exploration. Think of it as your crypto compass, pointing you in the right direction to do your own research and make informed decisions.
No legal, tax, investment, or financial advice should be inferred from these pixels. We’re not fortune tellers or stockbrokers, just passionate crypto enthusiasts sharing our knowledge.
And just like that rollercoaster ride in your favorite DeFi protocol, past performance isn’t a guarantee of future thrills. The value of crypto assets can be as unpredictable as a moon landing, so buckle up and do your due diligence before taking the plunge.
Ultimately, any crypto adventure you embark on is yours alone. We’re just happy to be your crypto companion, cheering you on from the sidelines (and maybe sharing some snacks along the way). So research, explore, and remember, with a little knowledge and a lot of curiosity, you can navigate the crypto cosmos like a pro!
UnCirculars – Cutting through the noise, delivering unbiased crypto news


