

Trading indicators can be categorized as leading indicators, lagging indicators, or even both, based on the type of information they provide and their speed of response relative to price action. Understanding how they work will help you know the best way and time to use certain indicators in the market during technical analysis. The knowledge can also help you better interpret market events based on the indicators you use.
What are leading and lagging indicators?
Leading and lagging indicators are technical indicators that give crypto traders an idea of what may happen next in the market or what has already happened. Both indicators provide traders with market information to guide their trading decisions. The major difference between the two indicators is the timing of the signal they provide.
Leading indicators
Leading indicators are indicators that indicate where the price may move next. These indicators use price data to predict future price movements. Leading indicators can help you spot trends early, providing favorable trade entry and exit points. They are often more informative for technical analysis because they can help you in your quest to enter high probability trades.
Lagging indicators
Lagging indicators are also known as trend following indicators simply because they follow market trends. These indicators only focus on historical data and do not suggest what may happen next in the market. They use the average of past price data to inform traders of market events.
5 Examples of leading and lagging indicators
To better understand how these technical indicators work, consider the following examples.
Leading Indicator: Fibonacci Retracement
Fibonacci retracement levels are horizontal lines used to determine possible support and resistance levels. The indicator can help you to determine trade entry, stop loss and take profit points. Fibonacci retracement works best in a trending market.
If the price begins to decline or pull back in an uptrend, traders using the Fibonacci retracement tool will draw the retracement line to connect the last relevant swing high and swing low. Doing so will help them see the invisible support levels in the market, making it easy to determine where the price may reverse and continue the uptrend.
Leading Indicator: Candlesticks
A candlestick shows a market’s open, close, high and low prices within a specified time period. Each candlestick has specific information that it embodies. An educated trader understands the information and uses the information to find his way in the market. Put another way, each candlestick provides an easy-to-understand picture of the price action.
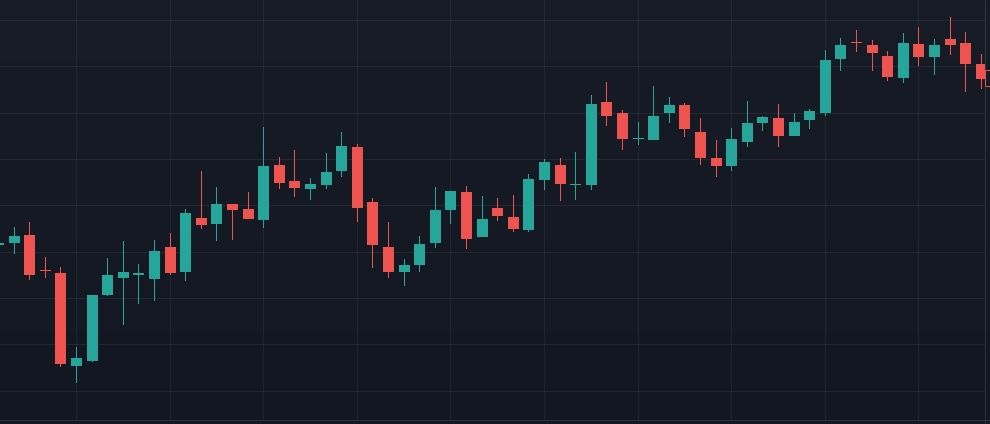
You can use the length of the candlesticks, the candlestick body, and whether it is bearish or bullish to determine what is happening in the market and what could happen. The common candlestick patterns include dojis, engulfing candlesticks, spinners, hammers and pin bars.
Lagging indicator: moving averages
Moving averages identify the trend and direction of a crypto market. The moving average information is generated using past price points, that is, the market’s historical data.
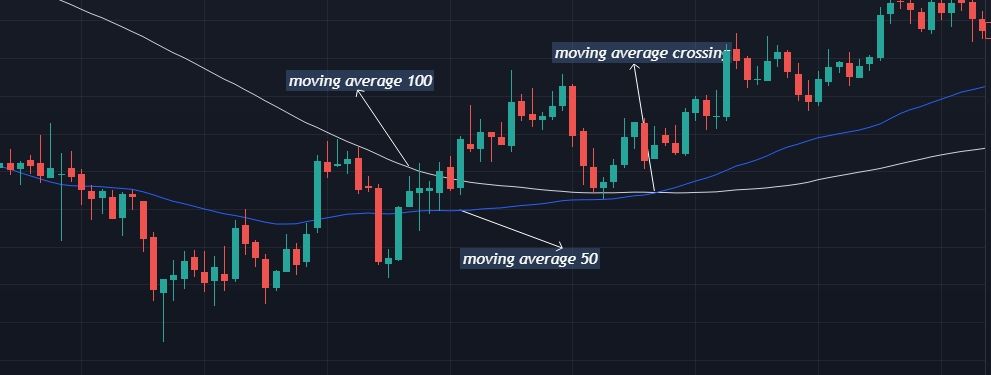
Moving average lines generate buy and sell signals when they cross, although traders cannot rely on them for the best trade entries. This is because by the time moving average lines show either buy or sell signals, the price movement must have started some time before then, making any reaction you make to the moving average signal.
Leading and lagging indicator: Bollinger Bands
Bollinger bands consist of a moving average, which serves as a middle band, and an upper and lower band, which identify whether the price is relatively high or low. Traders consider the upper band an overbought position and the lower band an oversold position. So they buy when the market is near or below the lower band and sell when it is near or above the upper band.
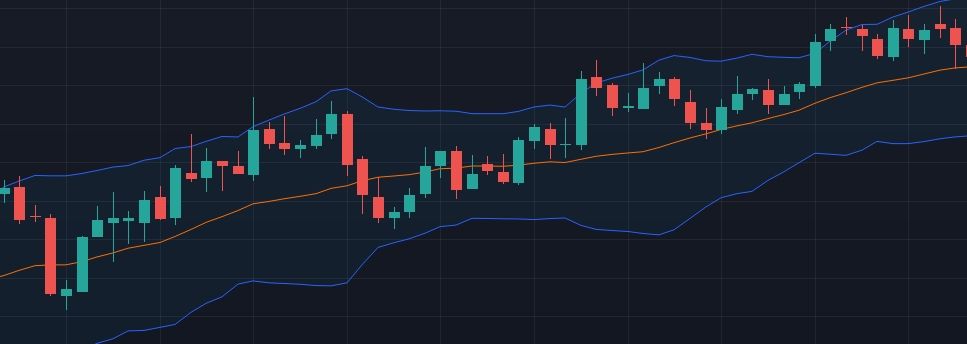
Bollinger bands, like RSI (see below), are inherently lagging indicators because they move after the price moves. They only react to price movements. However, the outer bands can act as leading indicators as they suggest when the price may reverse.
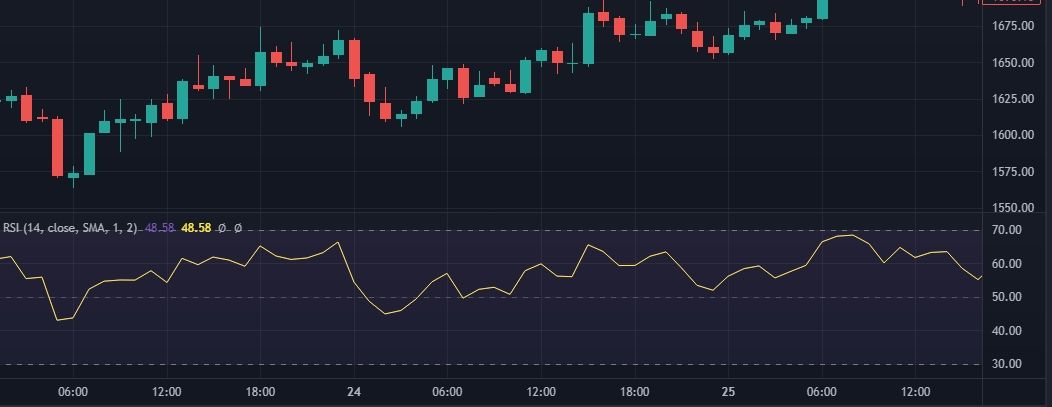
Leading and Lagging Indicator: Relative Strength Index
The Relative Strength Index (RSI), another inherently lagging indicator, tells crypto traders when a market is overbought or oversold. The RSI oscillates between 0 and 100, typically calculated over a 14-day period. A scale above 70 is considered overbought, and below 30 is oversold. The RSI also gives information about who is in control of the market. Traders usually take a scale above 50 as the buyer’s market and one below 50 as the seller’s market.
The big problem with depending on the RSI, just like other lagging indicators, is that the signals are usually late in coming. The market should have been bullish for a while before it reflects on the RSI chart.
The RSI can also function as a leading indicator, showing traders what may be happening in the market. Let’s look at the case of RSI divergence. RSI divergence signals that the current trend has lost momentum, and there is a possibility of a trend reversal. This can be considered an early warning sign and will reveal to traders that a possible reversal is imminent. In the case of an RSI divergence, the RSI shows a change in the market momentum before it reflects in the price, and thus works as a leading indicator.
How to use lagging and leading indicators
From the categorization above, you see that some crypto technical analysis indicators work as leading indicators, some as lagging indicators, while others are both leading and lagging indicators depending on how they are interpreted.
Some traders use a combination of leading and lagging indicators when trading. Some traders prefer to use only leading indicators, trade with Fibonacci retracement lines, support and resistance, candlestick languages, and which leading indicators they find useful. The categorization is primarily functional, as the choice of how you use it depends on your crypto trading strategy.
Now that you know how leading and lagging indicators work, you can better interpret chart information in relation to your strategy. For example, trying to enter a buy because there is a moving average crossover showing a buy signal is likely to be a late entry. Since the moving average is a lagging indicator, it is not good for determining trade entry and exit points.
On the other hand, lagging indicators are useful when reviewing historical data and how prices have moved over time. However, nothing stops you from using the information to predict future market events.
No indicator should be used as a stand-alone indicator. You should combine it with other tools to make better trading decisions.
As Shown
After understanding what leading and lagging indicators are, it is safe to say that both indicators are essential tools for successful trading. Choosing how to use it just depends on how your strategy works best. Surely we cannot deny that knowing how they work and how to interpret the data they provide will be an advantage for you when performing your market analysis.
Disclaimer for Uncirculars, with a Touch of Personality:
While we love diving into the exciting world of crypto here at Uncirculars, remember that this post, and all our content, is purely for your information and exploration. Think of it as your crypto compass, pointing you in the right direction to do your own research and make informed decisions.
No legal, tax, investment, or financial advice should be inferred from these pixels. We’re not fortune tellers or stockbrokers, just passionate crypto enthusiasts sharing our knowledge.
And just like that rollercoaster ride in your favorite DeFi protocol, past performance isn’t a guarantee of future thrills. The value of crypto assets can be as unpredictable as a moon landing, so buckle up and do your due diligence before taking the plunge.
Ultimately, any crypto adventure you embark on is yours alone. We’re just happy to be your crypto companion, cheering you on from the sidelines (and maybe sharing some snacks along the way). So research, explore, and remember, with a little knowledge and a lot of curiosity, you can navigate the crypto cosmos like a pro!
UnCirculars – Cutting through the noise, delivering unbiased crypto news


