

Traders use various technical indicators to make informed decisions about price direction and market activity. These indicators are designed for different purposes, with the Moving Average Convergence Divergence (MACD) indicator being one of the most widely used tools for determining price direction and momentum.
Let’s see how the MACD indicator works and how you can use it to determine trend direction and strength.
What is the MACD indicator?
MACD is a widely used technical analysis tool that crypto traders rely on to spot trend changes and potential buy or sell signals in the crypto market. It was developed by Gerald Appel in the late 1970s and has since found application in financial markets such as crypto, forex and stock markets.
What does MACD indicate?
By applying the MACD indicator, crypto traders can identify a series of important market trends, such as divergences, crossovers, and overbought and oversold positions, which are key indicators in market analysis. We will soon explore how this is done.
How does the moving average convergence divergence work?
The moving average convergence divergence (MACD) indicator measures the correlation between two moving averages and can be represented as a histogram, highlighting price strengths and weaknesses. To understand how this indicator works, it is essential to understand its fundamental features.
The MACD line
The MACD line, indicated by a blue line, is derived by subtracting the longer exponential moving average (EMA) from the shorter exponential moving average. The EMA is a moving average that places meaning on the most recent price data, making it responsive to recent price changes and a handy tool for identifying trends and buy and sell signals. EMA periods refer to the number of price points included in a particular measurement and depending on the indicator, you will use different EMA periods to find different trends.
The calculation involves subtracting the 26-period EMA from the 12-period EMA, and the difference is plotted on the chart along with a signal line.
The Signal Line
The signal line, on the other hand, is the 9-period EMA of the MACD line. As both the MACD and signal lines move above and below each other, they form bullish and bearish signals. We will explain this in more detail later in this article.
MACD Histogram
The MACD histogram shows the difference between the MACD line and the signal line, representing it as bars. When the bars are above the zero line, the MACD line is above the signal line. Conversely, when the bars are below the zero line, the MACD line is below the signal line. This histogram also helps crypto traders identify potential trends and trend reversals.
The zero line
The zero line is a straight line in the MACD indicator that separates the positive and negative parts of the chart. The MACD line moves above and below the zero line to show whether the market is bullish or bearish. If the histogram is above the zero line, it means the market is going up, and if it is below the zero line, it means the market is going down.
How to Use MACD in Crypto Trading
So how do you interpret the signals derived from the MACD indicator? There are several effective approaches to determining the prevailing market trend and identifying potential market reversal points.
1. MACD Bullish Trend
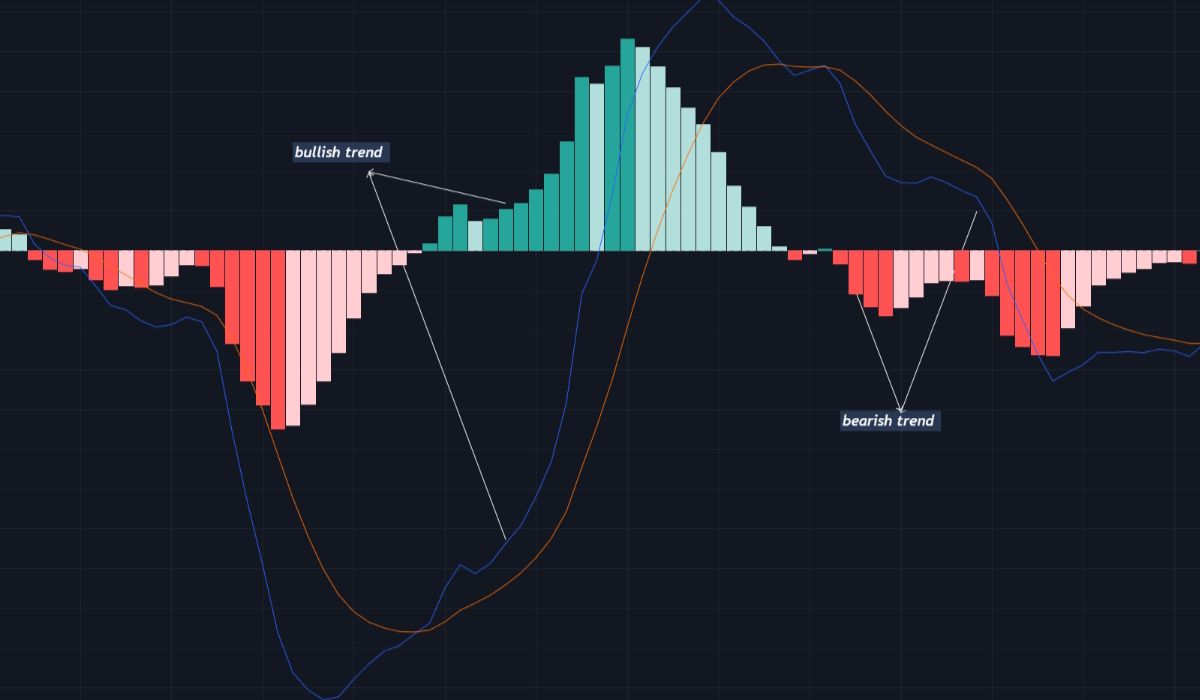
When the MACD line is above the signal line, the trend is considered bullish, and the further it is from the zero line, the stronger the trend. Traders can also determine market trends by examining the histogram. The trend is bullish when the histogram is above the zero line or green. Longer histogram bars indicate a stronger trend, while shorter bars indicate a weaker trend.
2. MACD Bearish Trend
In contrast, the MACD line remains below the signal line in a bearish trend, and the further apart they are, the stronger the trend becomes. When the histograms are below the zero line, the trend is bearish. The length of the histogram bars can also determine the strength of the trend.
3. MACD Crossover
A trend reversal indicates a shift in an ongoing trend, as suggested by its name. It indicates the point at which a previously bullish trend turns bearish or vice versa.
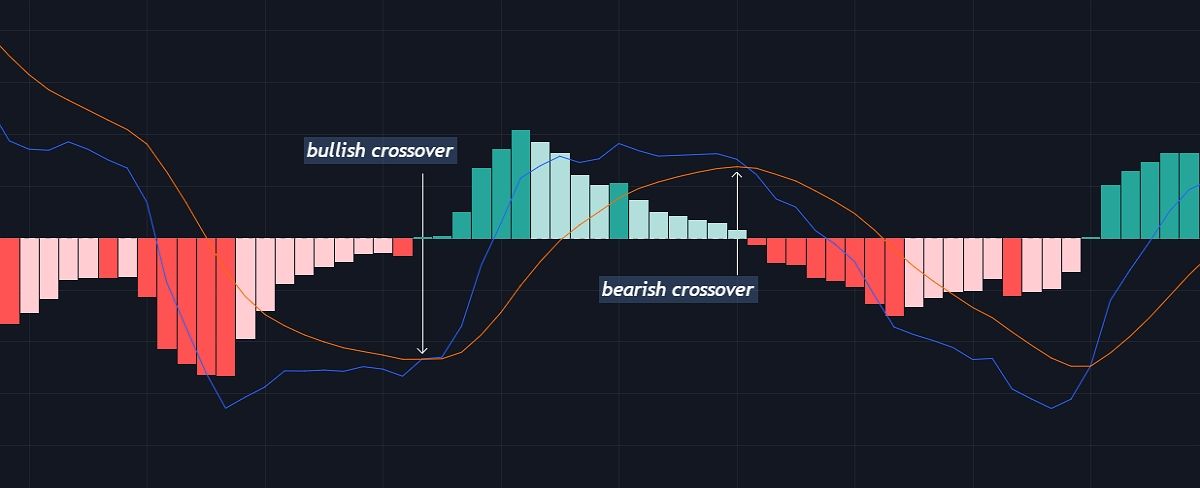
One common method of identifying a trend reversal is observing the crossing of the MACD and signal lines. When the MACD line crosses above the signal line in a bearish trend, it indicates a shift to a bullish trend. Conversely, the MACD line crossing below the signal line indicates a bearish reversal, suggesting that the trend may continue to move downward.
4. Overbought and oversold conditions
The MACD indicator can be used to identify overbought and oversold conditions. An overbought condition occurs when the MACD line is significantly higher than the signal line. At the same time, an oversold condition occurs when the MACD line is significantly lower than the signal line. Traders can use these signals to enter or exit positions based on their preferred trading strategy.
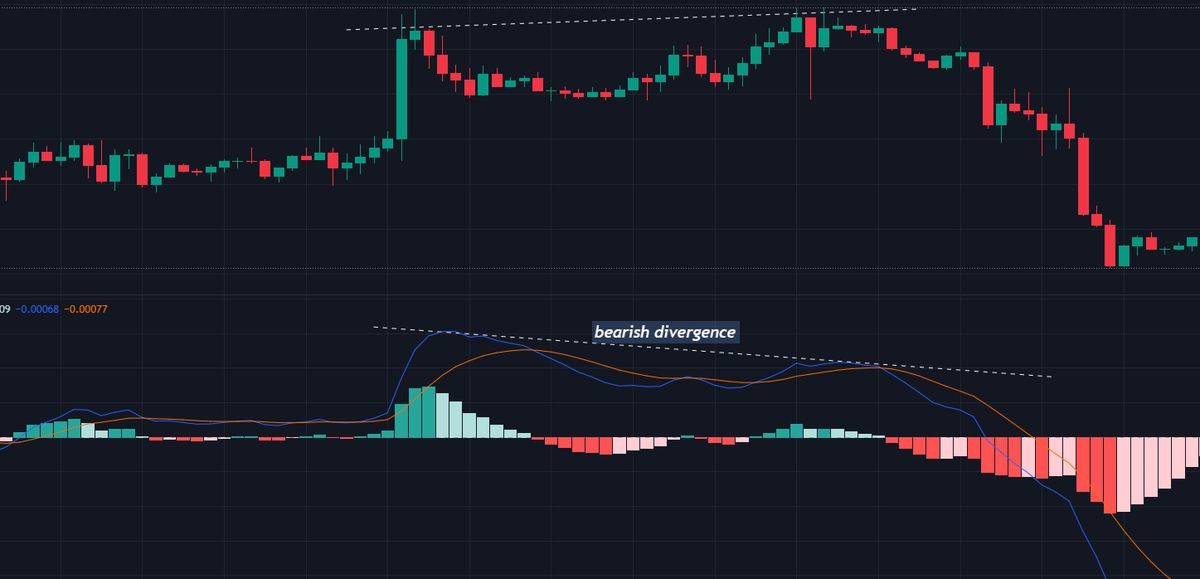
5. Price divergence
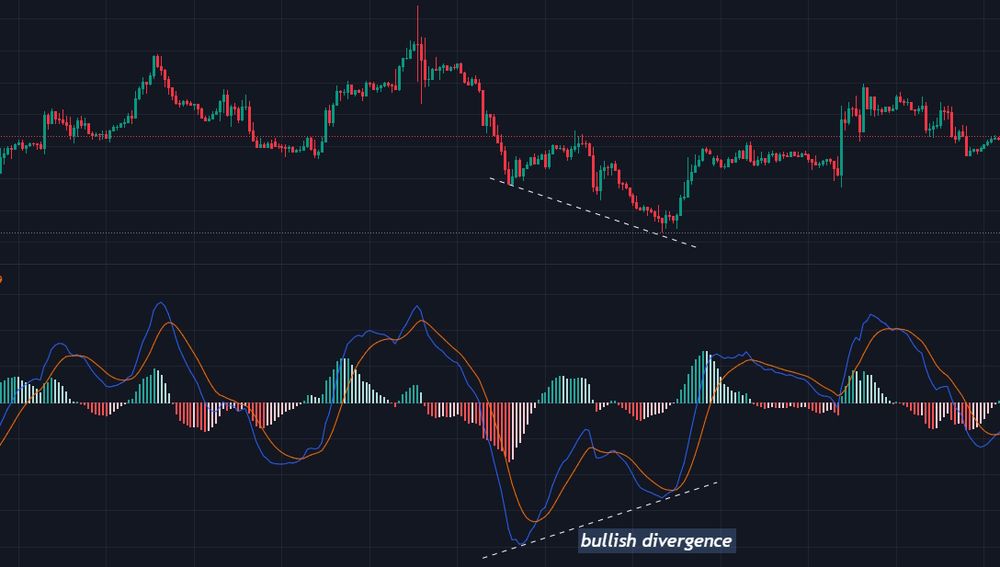
A divergence between the price and the MACD indicator can indicate a potential trend reversal. This occurs when the price makes new highs or lows, but the MACD does not follow. For example, in a bullish divergence, the price continues downward and forms a new low while the corresponding MACD indicates otherwise.
Conversely, the bearish divergence indicates a weakening price movement. Therefore, a possible reversal is imminent when a divergence occurs.
Limitations of the MACD indicator
Although the MACD indicator is a great tool for technical analysis, it is crucial to remember that it is not infallible. This produces false signals that trick traders into believing that a trend reversal is imminent, only for the ongoing trend to continue.
Additionally, price divergence, which MACD tries to identify, may not always accurately predict a trend reversal, as price may continue in the ongoing direction. As a result, traders must look for additional indicators or confirmations to validate potential moves.
Use MACD with other technical indicators
Since MACD can give false signals and its results can be affected by market volatility, traders should always use MACD in conjunction with technical indicators of various categories and fundamental analysis to make well-informed trading decisions.
As with many other technical indicators, MACD is subjective and can be adjusted to suit individual preferences. Traders often adjust parameters, such as a MACD histogram and the number of time periods used in the calculations, to align with their specific trading styles. The possible combinations of these parameters are unlimited and can lead to varied results, unique to each trader. This creates the need to study and test various configurations to determine the optimal settings for your strategy to achieve the best results.
Take time to practice
The Moving Average Convergence Divergence (MACD) indicator is a viable indicator that can provide traders with valuable insights into market trends, but it takes practice and experience to master. Moreso, its effectiveness depends on how well it is interpreted, and it varies depending on the type of traders who use it.
As a trader, it is important to take the time to use the MACD indicator and understand how it works in different market scenarios. This may involve analyzing and back-testing with historical data, testing different strategies and experimenting with different settings. Using the MACD indicator without practice and study can lead to continuous losses.
Disclaimer for Uncirculars, with a Touch of Personality:
While we love diving into the exciting world of crypto here at Uncirculars, remember that this post, and all our content, is purely for your information and exploration. Think of it as your crypto compass, pointing you in the right direction to do your own research and make informed decisions.
No legal, tax, investment, or financial advice should be inferred from these pixels. We’re not fortune tellers or stockbrokers, just passionate crypto enthusiasts sharing our knowledge.
And just like that rollercoaster ride in your favorite DeFi protocol, past performance isn’t a guarantee of future thrills. The value of crypto assets can be as unpredictable as a moon landing, so buckle up and do your due diligence before taking the plunge.
Ultimately, any crypto adventure you embark on is yours alone. We’re just happy to be your crypto companion, cheering you on from the sidelines (and maybe sharing some snacks along the way). So research, explore, and remember, with a little knowledge and a lot of curiosity, you can navigate the crypto cosmos like a pro!
UnCirculars – Cutting through the noise, delivering unbiased crypto news


